
With the recent strength in the Canadian market reaching new all time highs, and the Canadian Equity Asset Class moving into 3rd place replacing bonds, we are going to revisit the chart of the S&P/TSX Composite Index. We will explore a few of the reasons for this strength and where we may find support and resistance levels going forward. The second chart we will explore is the ZEB.TO or BMO S&P/TSX Equal Weight Banks Index ETF, with banks and insurance companies being some of the most influential movers in the index as of late.
S&P/TSX Composite Index (TSX.I)
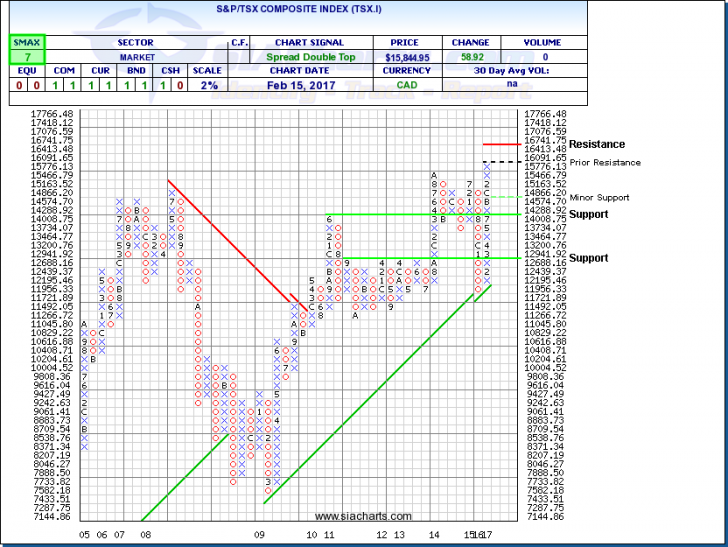
We last looked at the S&P/TSX Composite Index (TSX.I) back on Feb 2nd. At the time the index was testing resistance at all time highs, but had not managed to move through, and close above 15,657.63. As of the close last night the S&PTSX Composite Index has not only pushed through this level it has now risen for 7 straight days to set a fresh record high of 15,844.95. This close was led by gains in its financial services group after seeing strong economic data from both Canada and the United States.
Worth mentioning again is the move of Canadian Equity Asset Class into 3rd spot in the Asset Class Rankings. With the chart of TSX.I continuing to exhibit strength, and a move into new territory, we can look to find resistance in the 16,500 range, as mentioned on Feb 2nd. If we are to see any downside selling pressure, watch for support at 14,000 and then again just below 12,700. With an SMAX of 7 out of 10, the TSX.I is showing near term strength versus most of the asset classes.
Click on Image to Enlarge
BMO S&P/TSX Equal Weight Banks Index ETF (ZEB.TO)
The ZEB.TO or BMO S&P/TSX Equal Weight Banks Index ETF has never been covered in the Equity Leaders weekly, and with the current strength and overall financials helping push the index to new highs, now seems like a good time to explore the name. This ETF is comprised of and equal weight the big six banks in Canada and offers broad exposure to the Canadian Banking sector.
Looking at a few of the names we will see why the Chart of the ZEB.TO has been in an upward trajectory for quite some time. Analyzing 6 month return numbers alone, we see National Bank (NA.TO) up ~29%, Royal Bank (RY.TO) up ~24%, Bank of Montreal (BMO.TO) up ~23% with all 3 others posting strong numbers as well.
With recent data showing Canada’s manufacturing sales jumping for the second month in a row in December, along with U.S. inflation and retails sales climbing in January, the perceived economic strength is boding well for financials.
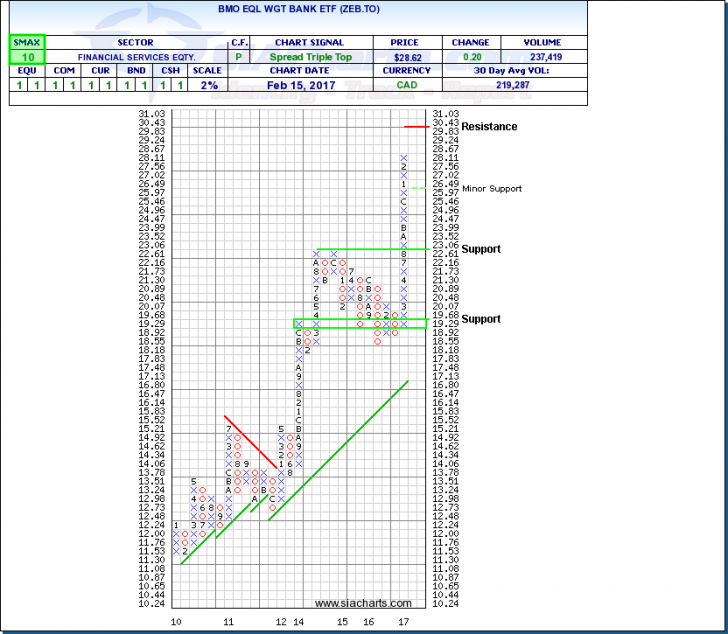
Looking at the chart we see ZEB.TO has been in a steady and rising column of X’s since the first quarter of 2016. Hitting all time high’s itself, we can look to ZEB.TO to hit resistance at the psychological $30 level. Minor support can be found at $25.97 and then again at a more significant level of $22.61 and again between $18.92 and $19.29. With a positive SMAX of 10 and exhibiting strength across all the asset classes, ZEB.TO looks poised to maintain its current strength.
Disclosure: ZEB.TO is presently held within certain portfolios managed by SIA Wealth Management Inc.
Click on Image to Enlarge
SIACharts.com specifically represents that it does not give investment advice or advocate the purchase or sale of any security or investment. None of the information contained in this website or document constitutes an offer to sell or the solicitation of an offer to buy any security or other investment or an offer to provide investment services of any kind. Neither SIACharts.com (FundCharts Inc.) nor its third party content providers shall be liable for any errors, inaccuracies or delays in content, or for any actions taken in reliance thereon.
For a more in-depth analysis on the relative strength of the equity markets, bonds, commodities, currencies, etc. or for more information on SIACharts.com, you can contact our sales and customer support at 1-877-668-1332 or at siateam@siacharts.com.
Copyright © SIACharts.com