by Ryan Detrick, LPL Research
Happy anniversary 2016 S&P 500 lows! A year ago on February 11, the S&P 500 closed at 1829.08, some 14% off the all-time highs and a fresh new 52-week low. It was a scary time, as we saw high-profile calls to “sell everything,” while many other firms cut their year-end targets. With the S&P 500 down more than 10% year to date after 28 trading days, it was the worst start to a year ever—so calls like that might sound senseless today, but at the time it didn’t seem so outrageous.
We noted at the time that the amount of fear we were seeing after a 14% correction was more in line with previous 50% market crashes, so there was a chance things were overdone. Also, bad starts to a year historically weren’t a reason to sell. Things are never that black and white, and we too were concerned events could quickly spiral out of control. However, looking at past history and sentiment helped us to expect the bull market to continue and equities to finish the year up mid-single digits (although the S&P 500 managed to exceed our target and gain 9.5% for 2016, we are happy with our call to stand pat a year ago).
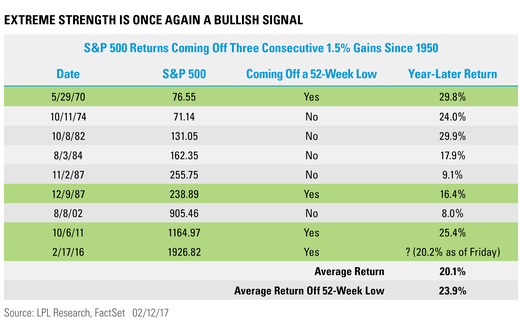
Now the big question is: How do you know things have officially turned around? Was there a clear signal a year ago that the worst was indeed over? We noted one signal at the time as potentially very positive, and it stood out over all the others from 2016. Per Ryan Detrick, Senior Market Strategist, “The S&P 500 closed higher at least 1.5% for three consecutive days off the February 2016 lows, but this also took place coming off a 52-week low. This incredibly rare combo had only happened three other times since 1950,* and the S&P 500 was up 23.9% a year later on average and higher all three times. Sure enough, the S&P 500 has been up 20.1% since the signal last February.”
Not to be outdone, during the previous eight times when the S&P 500 was up 1.5% for three consecutive days (so not necessarily off a 52-week low, but anytime), the index was higher a year later all eight times, with an average return a year later of 20.1%.
This is just one signal, and a sample of only three is very tough to put our full faith into it. However, when other factors like sentiment, fundamentals, and valuations all supported the bullish case (like they did a year ago), a rare signal like this could be what we are looking for to support the bullish case and suggest the worst is indeed over.
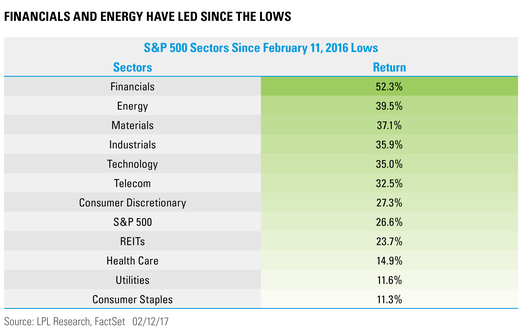
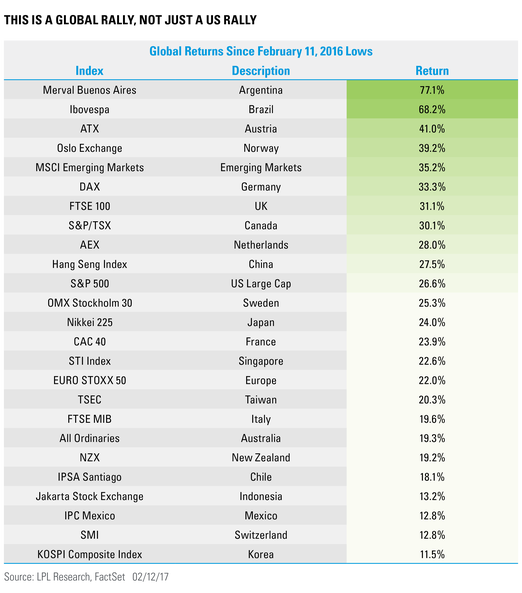
We will leave with some of the impressive returns over the past year; what a 12 months it has been!
IMPORTANT DISCLOSURES
*Please note: The modern design of the S&P 500 stock index was first launched in 1957. Performance back to 1950 incorporates the performance of predecessor index, the S&P 90.
Past performance is no guarantee of future results. All indexes are unmanaged and cannot be invested into directly.
The opinions voiced in this material are for general information only and are not intended to provide or be construed as providing specific investment advice or recommendations for any individual security.
The economic forecasts set forth in the presentation may not develop as predicted.
Investing in stock includes numerous specific risks including: the fluctuation of dividend, loss of principal and potential illiquidity of the investment in a falling market.
The S&P 500 Index is a capitalization-weighted index of 500 stocks designed to measure performance of the broad domestic economy through changes in the aggregate market value of 500 stocks representing all major industries.
This research material has been prepared by LPL Financial LLC.
To the extent you are receiving investment advice from a separately registered independent investment advisor, please note that LPL Financial LLC is not an affiliate of and makes no representation with respect to such entity.
Not FDIC/NCUA Insured | Not Bank/Credit Union Guaranteed | May Lose Value | Not Guaranteed by any Government Agency | Not a Bank/Credit Union Deposit
Securities and Advisory services offered through LPL Financial LLC, a Registered Investment Advisor Member FINRA/SIPC
Tracking #1-581438 (Exp. 2/18)
Copyright © LPL Research


