
This week in the SIA Equity Leaders Weekly, we are going to relook at the US Dollar vs. Canadian Dollar relationship and see how the point and figure chart looks at the beginning of 2017 in light of expected US Fed’s recent comments on the expectation to raise rates “a few times a year” going forward if the US economy continues to show strength. Janet Yellen continued to say that it makes sense to “gradually reduce” the level of support the Fed is providing by raising interest rates. Also going to take a look at an updated Crude Oil chart to see how the Dollar's strength or weakness may be affected this commodity.
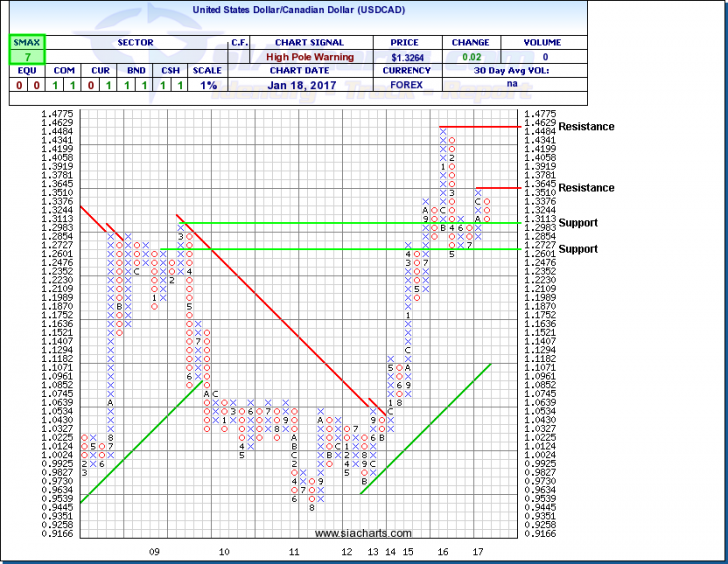
United States Dollar/Canadian Dollar (USDCAD)
"Now, it's fair to say, the economy is near maximum employment and inflation is moving toward our goal," Yellen said in a speech Wednesday in San Francisco. These recent comments saw the USD/CAD relationship go up 1.67% yesterday in favor of the US Dollar. This coming off a day before that saw the USDCAD move down to the first support level at $1.2983 into a new column of O’s. If this support holds, look for it to re-challenge its December highs at the $1.3645 resistance level.
Further resistance could be seen above at $1.463 and further support below is found around $1.26. The USDCAD currently has an SMAX score of 7 out of 10 still showing more strength long-term to the US Dollar. With the planned spending by the President Elect at the beginning of his term and Yellen commenting recently that the U.S. “economy is near maximum employment and inflation is moving towards our goal,” most expect that the Fed will raise rates a “few times a year” in 2017 and possibly beyond which could lead to more strength in the U.S. Dollar Index over other worldwide currencies.
Bank of Canada Governor Stephen Poloz also hinted yesterday that an interest rate cut remains in play as the Canadian central bank weighs the potential impact of a US protectionist policy under Donald Trump and if economic weakness continues in Canada it could take a “material” hit. Mr. Poloz’s statements of “Yes, a rate cut remains on the table,” saw the Canadian dollar tumble a full U.S. cent following his comment. Interest rate policy in both the US and Canada will be important to the moves associated with this currency pair in the future.
Click on Image to Enlarge
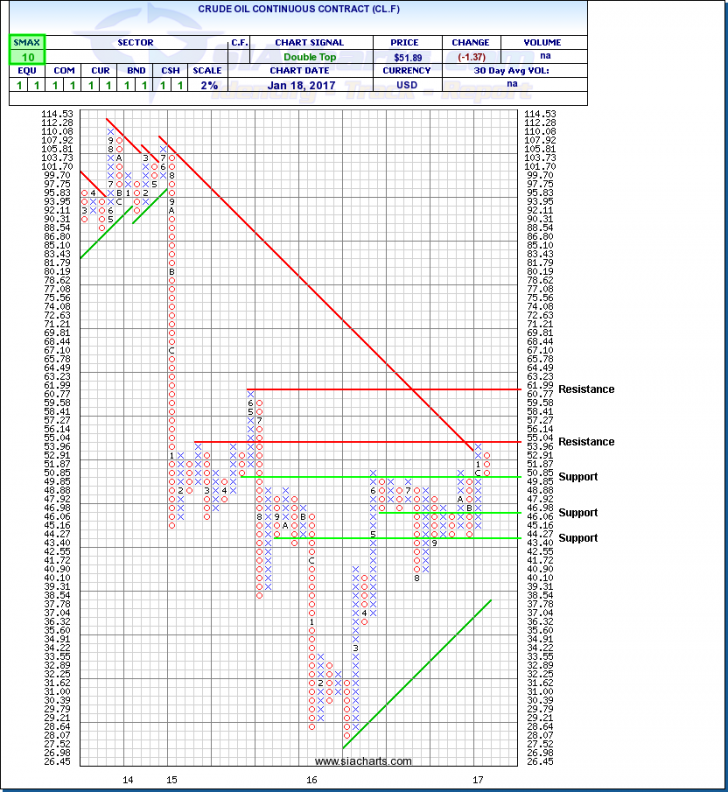
Crude Oil Continuous Contract (CL.F)
A report from the U.S. Energy Information Administration (EIA) is reporting that U.S. energy firms are boosting drilling activity and production even as OPEC’s efforts to trim supply and reduce excess inventories. OPEC, Russia and other non-OPEC producers in November and December pledged to cut oil output by nearly 1.8 million bpd, initially for six months, to bring supplies back in line with consumption. But the OPEC report also suggested that U.S. output could rebound higher especially in shale drilling which the EIA is now starting to show is happening. This back and forth on supply and demand could mean a trading range for Crude Oil (CL.F) around the current levels as it current sits at $51.42.
On a 2% scale for a point and figure chart for CL.F, it has moved down into a column of O’s towards the first support level at $49.85 with further support below at around $46 should this trend continue. Resistance above held at $55 and will be an important level to watch if broken as the next resistance level is found above at $62. It will also be important to watch to see if the U.S. Dollar can continue to rally in tandem with Crude Oil given their historical relationship to one another.
Click on Image to Enlarge
SIACharts.com specifically represents that it does not give investment advice or advocate the purchase or sale of any security or investment. None of the information contained in this website or document constitutes an offer to sell or the solicitation of an offer to buy any security or other investment or an offer to provide investment services of any kind. Neither SIACharts.com (FundCharts Inc.) nor its third party content providers shall be liable for any errors, inaccuracies or delays in content, or for any actions taken in reliance thereon.
For a more in-depth analysis on the relative strength of the equity markets, bonds, commodities, currencies, etc. or for more information on SIACharts.com, you can contact our sales and customer support at 1-877-668-1332 or at siateam@siacharts.com.
Copyright © SIACharts.com