
by Ryan Detrick, Senior Market Strategist, LPL Financial
“Buy the rumor, sell the news.” Quoted by investors for decades.
That is one of the oldest trading axioms, and it is also one we’ve been hearing a lot lately regarding the U.S. presidential election and upcoming inauguration. We’ve seen the buying; now could selling take place once the inauguration is official?
For starters, going back to the 1952 election and the January 1953 inauguration of President Eisenhower, there seems to have been some near-term strength after the inauguration, but one month later, some weakness has been perfectly normal.
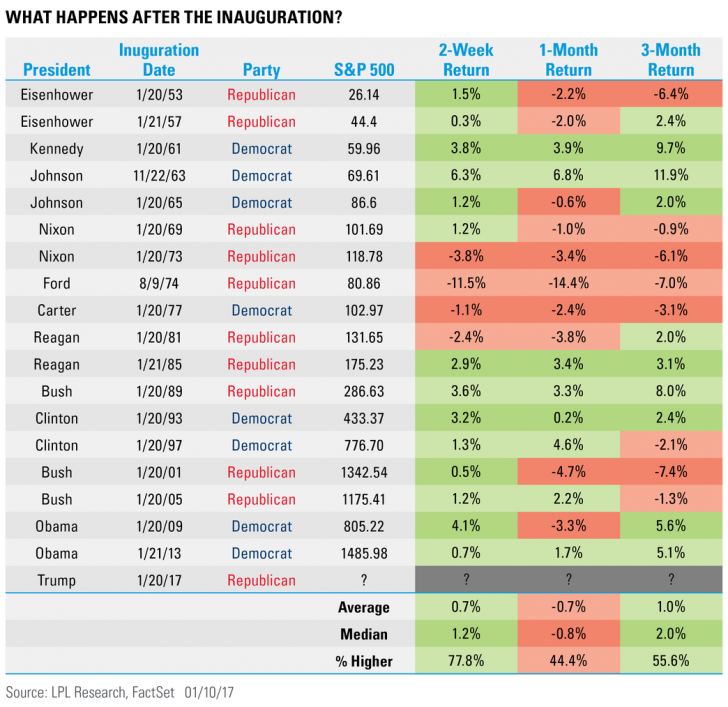
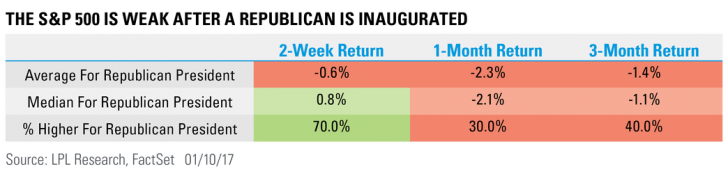
Here’s the catch: a closer look above shows there has tended to be more weakness after a Republican is inaugurated. Sure enough, the results have been weaker across the board.
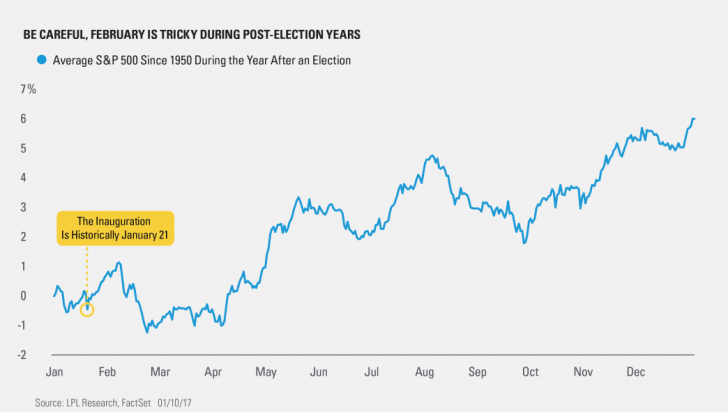
What about post-election years? Per Ryan Detrick, Senior Market Strategist, “Post-election years have tended to see a bounce in the near term after the inauguration, but then there’s February. Looking at all post-election years going back to 1950, February has been down 1.8% on average—making it the worst month of the year. It might be the shortest month of the year, but be on the lookout for any banana peels this year.”
Here’s what the average post-election year for the S&P 500 has looked like:
Last, here’s a chart we’ve shared before and want to share it once again, as it has been in the news and social media during the past few days. The Economic Policy Uncertainty Index in November spiked to one of its highest levels ever. This index measures levels of uncertainty by focusing on newspapers and tax code data, among other macroeconomic variables. With the incoming Trump presidency increasing uncertainty on exactly what his policies will be, it isn’t a surprise economic uncertainty has been very high.
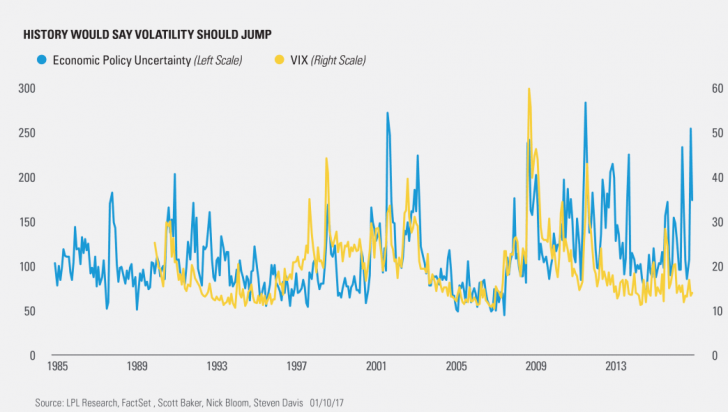
Why this matters is during previous times of high uncertainty, the CBOE Volatility Index (VIX) has usually spiked. That makes sense, as volatitly spikes during times of uncertainty. Well, this time we’ve seen a big spike in uncertainty, yet the VIX hasn’t even budged. Instead, it is near multiyear lows.
This is one potential clue that higher volatility could be coming and should that happen, it could produce downward pressure on equities right in time for the historically weak February timeframe.
*****
IMPORTANT DISCLOSURES
*Please note: The modern design of the S&P 500 stock index was first launched in 1957. Performance back to 1950 incorporates the performance of predecessor index, the S&P 90.
Past performance is no guarantee of future results.
The opinions voiced in this material are for general information only and are not intended to provide or be construed as providing specific investment advice or recommendations for any individual security.
The economic forecasts set forth in the presentation may not develop as predicted.
Indices are unmanaged and cannot be invested into directly. Unmanaged index returns do not reflect fees, expenses, or sales charges. Index performance is not indicative of the performance of any investment.
Investing in stock includes numerous specific risks including: the fluctuation of dividend, loss of principal and potential illiquidity of the investment in a falling market.
There is no guarantee that a diversified portfolio will enhance overall returns or outperform a nondiversified portfolio. Diversification does not ensure against market risk.
The Standard & Poor’s 500 Index is a capitalization-weighted index of 500 stocks designed to measure performance of the broad domestic economy through changes in the aggregate market value of 500 stocks representing all major industries.
The VIX is a measure of the volatility implied in the prices of options contracts for the S&P 500. It is a market-based estimate of future volatility. When sentiment reaches one extreme or the other, the market typically reverses course. While this is not necessarily predictive, it does measure the current degree of fear present in the stock market.
This research material has been prepared by LPL Financial LLC.
To the extent you are receiving investment advice from a separately registered independent investment advisor, please note that LPL Financial LLC is not an affiliate of and makes no representation with respect to such entity.
Not FDIC/NCUA Insured | Not Bank/Credit Union Guaranteed | May Lose Value | Not Guaranteed by any Government Agency | Not a Bank/Credit Union Deposit
Securities and Advisory services offered through LPL Financial LLC, a Registered Investment Advisor Member FINRA/SIPC
Tracking #1-571276 (Exp. 1/18)
Copyright © LPL Financial