
For our last Equity Leaders Weekly of 2016, we thought we would do a quick update on both the US and Canadian equity markets via the S&P 500 Index (SPX.I) and the S&P/TSX Composite Index (TSX.I). 2016 has been an eventful year for the markets where we started the year in risk off mode with a large sell off in equities around the globe. This sell off in equities brought strength to both bonds and other safe haven assets which had strong runs earlier in the year. We saw the USDCAD spike to over $1.40 and then have a strong pull back all while oil was trying to rally from its bottom formation. The markets weathered a surprise Brexit, as well as responding positively to the somewhat surprise election victory for Donald Trump in the United States.
S&P 500 Index (SPX.I)
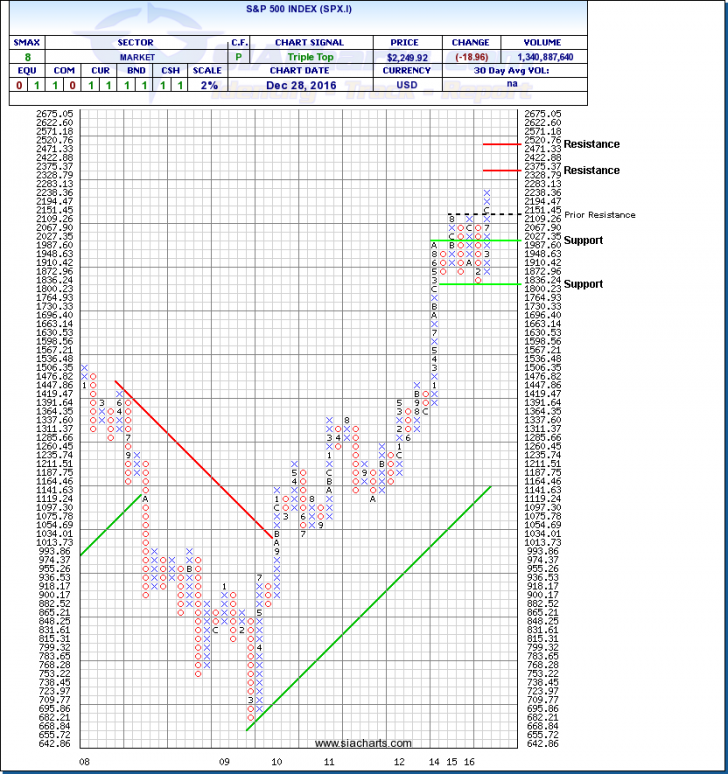
Since we last spoke of the S&P 500 at the end of November we can see in the chart that the index has added another X, continuing to push through on to all-time highs. Since the election, the S&P 500 Index has been up as high as 2,271 in mid December, having somewhat leveled off recently to close at 2,249.92 on Wednesday. The SPX.I chart is still in its column of X’s where the next level of resistance to come into play is at around 2,350 and above this at ~2,500. Support for SPX.I will come at the prior resistance level of 2,151 and below this at ~2,000 and ~1,800. With an SMAX of 8 out of 10, SPX.I is showing near term strength versus the asset classes.
Click on Image to Enlarge
S&P/TSX Composite Index (TSX.I)
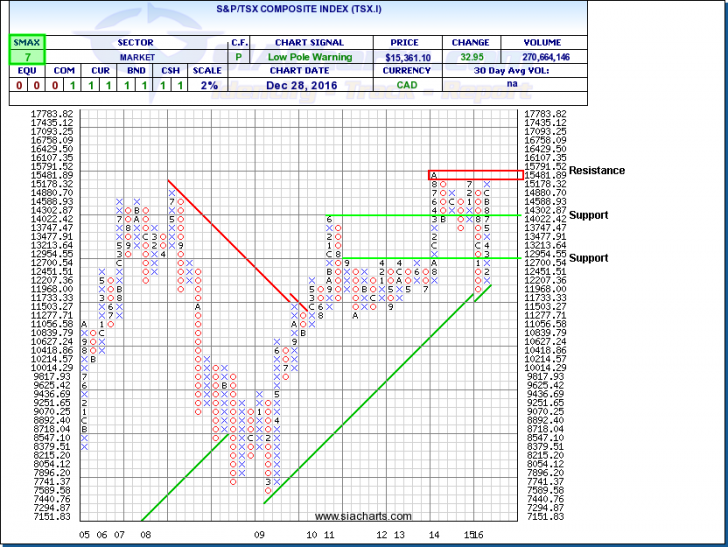
Without any major market shock, the TSX Composite Index is looking to close the year out deep in the green returning ~18% which would be the index’s best year since 2009. After a sharp pull back to begin 2016 the Canadian market was set to make a run on the back of major commodities like oil and natural gas, financials, and both precious and base metals. In looking at the 2% chart, the TSX.I has been in a long column of X’s since late January and is now trying to get past some very strong resistance levels between 15,500 and all-time highs at 15,791. Downside support for TSX.I can be found at 14,000 and below at 12,700. With an SMAX of 7 out of 10, TSX.I is showing some near term strength versus the asset classes.
Click on Image to Enlarge
SIACharts.com specifically represents that it does not give investment advice or advocate the purchase or sale of any security or investment. None of the information contained in this website or document constitutes an offer to sell or the solicitation of an offer to buy any security or other investment or an offer to provide investment services of any kind. Neither SIACharts.com (FundCharts Inc.) nor its third party content providers shall be liable for any errors, inaccuracies or delays in content, or for any actions taken in reliance thereon.
For a more in-depth analysis on the relative strength of the equity markets, bonds, commodities, currencies, etc. or for more information on SIACharts.com, you can contact our customer support at 1-877-668-1332 or at siateam@siacharts.com.
Copyright © SIACharts.com