
Monthly Market Risk Update: December 2016
by Brad McMillan, CIO, Commonwealth Financial Network
 Just as I do with the economy, I review the market each month for warning signs of trouble in the near future. Although valuations are now high—a noted risk factor in past bear markets—markets can stay expensive (or get much more expensive) for years and years, which doesn’t give us much to go on timing-wise.
Of course, there are other market risk factors beyond valuations. For our purposes, two things are important: (1) to recognize when risk levels are high, and (2) to try and determine when those high risk levels become an immediate, rather than theoretical, concern. This regular update aims to do both.
Risk factor #1: Valuation levels
When it comes to assessing valuations, I find longer-term metrics—particularly the cyclically adjusted Shiller P/E ratio, which looks at average earnings over the past 10 years—to be the most useful in determining overall risk.
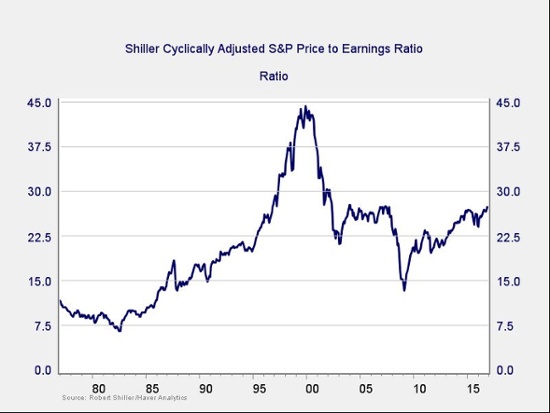
Two things jump out from this chart. First, after the pullback at the start of the year, valuations are again around the levels of 2007–2008 and 2015, when previous drawdowns started. Second, even at the bottom of the recent pullback, valuations were still at levels above any point since the crisis and well above levels before the late 1990s.
Although close to their highest level over the past 10 years, valuations remain below the 2000 peak, so you might argue that this metric is not suggesting immediate risk. Of course, that assumes we might head back to 2000 bubble conditions, which isn’t exactly reassuring. Risk levels remain high, although not immediate.
Risk factor #2: Changes in valuation levels
As good as the Shiller P/E ratio is as a risk indicator, it’s a terrible timing indicator. One way to remedy that is to look at changes in valuation levels over time instead of absolute levels.
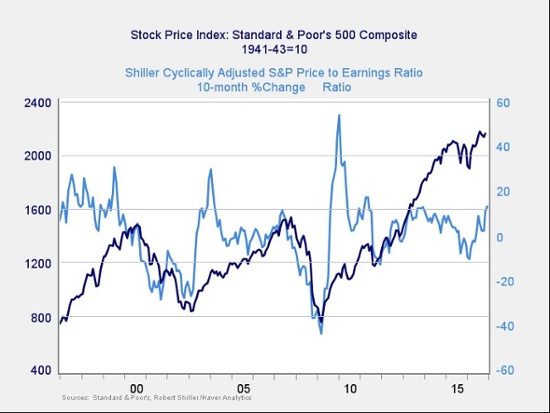
Here, you can see that when valuations roll over, with the change dropping below zero over a 10-month or 200-day period, the market itself typically drops shortly thereafter. With the recent recovery, this indicator moved back out of the trouble zone, and with the post-election rally, it moved even further into positive territory. Although risks remain, they may not be immediate. Still, this metric bears watching.
Risk factor #3: Margin debt
Another indicator of potential trouble is margin debt.
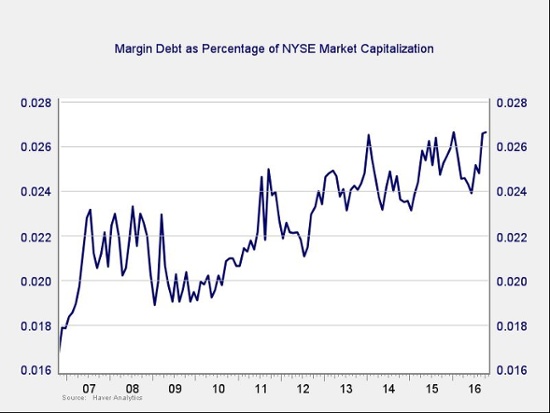
After a decline due to the recovery from the pullback at the start of the year, debt levels have climbed over the past several months, back to the highest level since the financial crisis. This kind of increase suggests risk levels are rising again, and they remain high by historical standards. But again, though this metric bears watching, the risk is not necessarily immediate.
Risk factor #4: Changes in margin debt
Consistent with this, if we look at the change in margin debt over time, spikes in debt levels typically precede a drawdown.
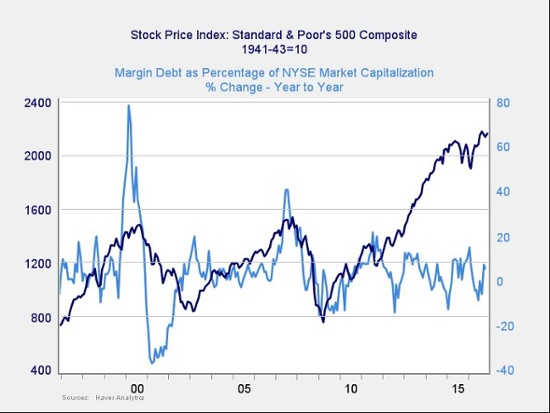
With the absolute risk level high, the immediate risk level is also rising. The change in debt indicator is approaching the 10-percent annual increase that suggests risk is becoming more immediate. Overall, although this metric still isn't indicating immediate risk, it is heading that direction.
Risk factor #5: The Buffett indicator
Said to be favored by Warren Buffett, the final indicator is the ratio of the value of all the companies in the market to the national economy as a whole.
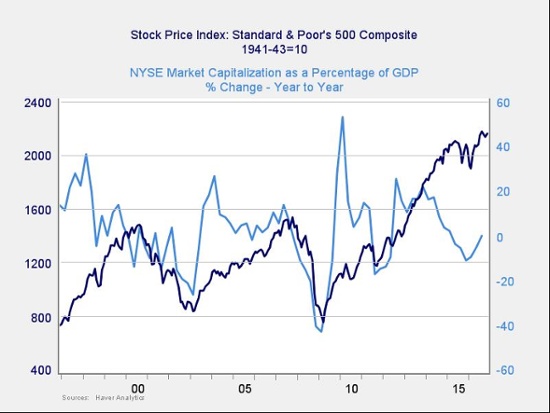
On an absolute basis, the Buffett indicator is actually somewhat encouraging. Although it remains high, it has pulled back to less extreme levels. On a change-over-time basis, however, downturns in this indicator have typically led market pullbacks—and once again, we see that here. With the recent uptick, though, this indicator suggests the risks are not immediate.
Technical metrics are also reasonably encouraging, with all three major U.S. indices well above their 200-day trend lines and continuing to hit new highs. With rising earnings and improving sentiment across the board—consumers, business, and investors—it’s quite possible that the advance will continue. The break into new territory could continue to propel the market higher, despite the high valuation risk level.
On balance, all of the metrics are in what has historically been a high-risk zone, so we should be paying attention. But, as I’ve said many a time, there’s a big difference between high risk and immediate risk—and it is one that’s crucial to investing. As it stands, none of the indicators suggests an immediate problem, although several suggest risk may be rising.
Commonwealth Financial Network is the nation’s largest privately held independent broker/dealer-RIA. This post originally appeared on Commonwealth Independent Advisor, the firm’s corporate blog.
Copyright © Commonwealth Financial Network