
by Corey Hoffstein, Newfound Research
- With 10-year rates jumping over 40bp in November, investors are beginning to talk about rising rates again.
- While rising rates may cause short-term volatility, coupon yield is a much more significant contributor to portfolio return over the long run. Increasing rates actually allow us to reinvest at higher coupon rates, helping offset the short-term losses.
- The bigger risk for asset allocators may be persistently lower interest rates than historically experienced, causing bonds to be a constant drag on portfolio expected return.
With the rapid jump in 10-year US Treasury rates in November – from 1.83% to 2.36% as of Friday’s market close – we’re beginning to once again hear rumbling concerns about rising rates.
While some have pointed out that the 10-year rate has simply made a round-trip return to where it began the year, this has done little to assuage investor concerns. After all, bonds are typically meant to serve the role of volatility dampener within the portfolio, not volatility instigator.
Our view, however, is that concern around rising rates is often much ado about nothing. Why? Let’s explore.
The Oft Forgotten Role of Income
Often when we hear investors express concern over rising rates, it is because they are singularly focused on the associated mark-to-market losses that are associated. What they ignore is that rising rates give us the ability to roll out of low coupon bonds and reinvest the proceeds into bonds with higher coupons.
To demonstrate the power of this effect, we wanted to construct an example that would be similar to how many modern investors access bonds today: constant maturity portfolios. Specifically, we will be looking at the intermediate-term U.S. Treasury bond portfolio. We assume the portfolio buys 10-year U.S. Treasuries at par and holds them for 3 years (collecting the coupons along the way, but not reinvesting them for simplicity). After the 3-year holding period ends, we sell the bond, reinvesting the proceeds in the new 10-year Treasury. This is very similar to how the the iShares 7-10 Year U.S. Treasury ETF (“IEF”) operates.
Returns in this portfolio come from three places.
- Coupons collected over the three year investment period.
- Roll yield generated from buying a 10-year bond and selling it 3 years later as a 7-year bond.
- Changes in interest rates.
For those unfamiliar, roll yield comes from the fact that the yield curve generally has an increasing slope, reflecting the term risk associated with lending money over longer periods of time. Assuming the yield curve stays constant and the 10-year rate is higher than the 7-year rate, then if we buy a 10-year bond and wait 3 years, our now 7-year bond will offer a coupon higher than the prevailing 7-year Treasury yield. Therefore, our bond will trade above par. Since we bought the bond at par, we have an embedded gain. Selling it locks in that gain.
For simplicity, we are going to combine roll yield and change in interest rates into a single “rebalance” return that captures the effect of locking in any gains or losses when we rollover into new bonds every 3 years.
The plot below shows end-of-period annualized results for running this strategy. So at each point in time, it shows the returns you would have received had you bought a 10-year US Treasury 3 years earlier, collected the coupons along the way (not reinvesting them), and sold it based upon the current 7-year US Treasury rate.
It is important to note that this is not the same as a rolling 3-year annualized performance plot for a constant maturity index.
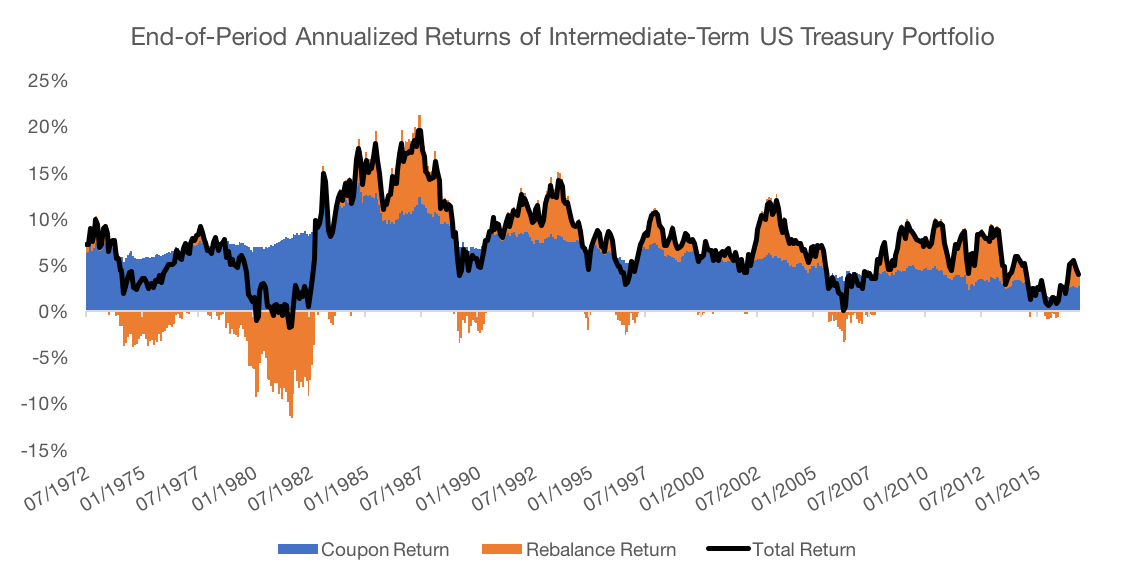
Source: St. Louis Federal Reserve. Calculations by Newfound Research. The starting date is selected based upon the data availability of 10-year constant maturity US Treasury rates (“DGS10”) and 7-year constant maturity US Treasury rates (“DGS7”). Returns are purely hypothetical and backtested. Past performance is not a predictor of future returns.
The purpose of this plot is to demonstrate that over the period which the bond rolls from being a 10-year to a 7-year, the coupons collected can play a large, offsetting role against increases in interest rates. In fact, only 1.5% of periods end up with a negative total return.
From 12/31/1969 to 12/31/1979, 10-year rates climbed from 7.88% to 10.33%. While the rebalance return for this period was negative, most of these losses were offset by the coupon return generated. In fact, we can see that as rates climbed further in the 80s, despite the fact that rebalance returns plunge into negative territory, the high coupon rates were able to offset most of these losses.
After 10-year rates peaked in 1981, we can see that rebalance return played a largely positive roll. However, income return from the coupons collected remained high and steady. In fact, coupon return has made up 71.9% of total return since 12/31/1981. It was not until recently, with interest rates at record lows, that rebalance return comes close to matching coupon return.
It is not an understatement that income has historically played a dominant role in historical returns of constant maturity bond portfolios.
We’ve explored the past: but what about the future? Technically, results will depend entirely upon the interest rate path that occurs.
Many investors, however, consider the nightmare scenario to be the one where rates rewind themselves back to their peak 30 years ago. So what do results look like if we replay rate changes in reverse?
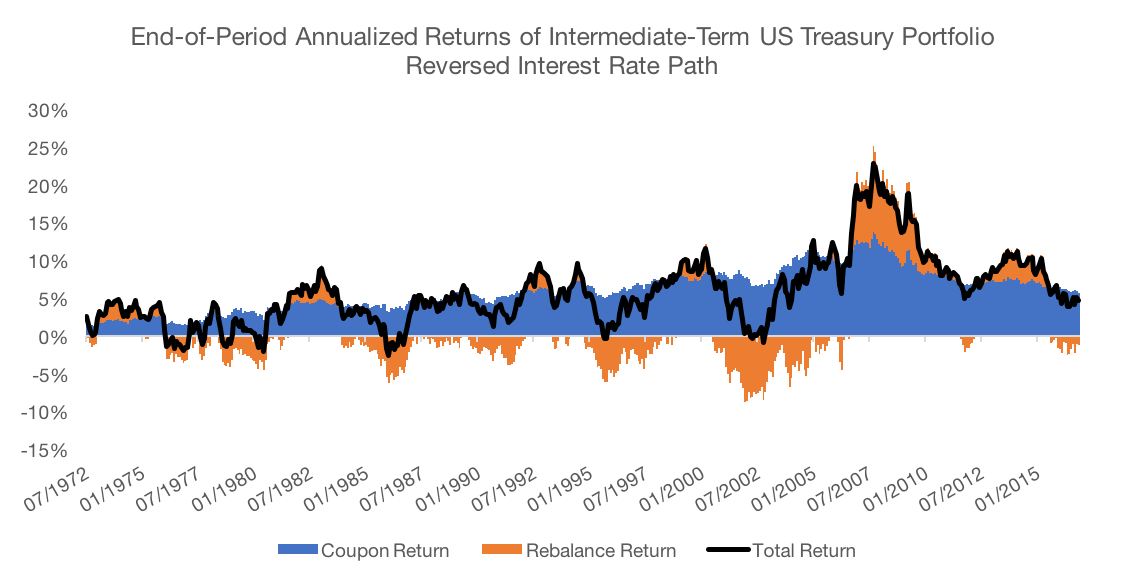
Source: St. Louis Federal Reserve. Calculations by Newfound Research. The starting date is selected based upon the data availability of 10-year constant maturity US Treasury rates (“DGS10”) and 7-year constant maturity US Treasury rates (“DGS7”). Returns are purely hypothetical and backtested. Past performance is not a predictor of future returns.
What we can see is that, again, coupon return is able to largely offset the steady increase in rates. In fact, the worst annualized total return is -2.52%, which reflects the reverse of the three-year period when rates fell from 6.29% to 3.37% from May 31, 2000 to May 31, 2003. In reverse, that’s a 292 basis point rate hike over a 3-year period, offset almost entirely by the three years of collecting 3.37% in coupons.
How Far Could Rates Climb Anyway?
While we think it is a foolish waste of time to try to predict what exactly the market will do in the future, particularly in the short term, we do think it there are definitive guide posts that can help steer a long-term outlook.
We think that with a long-term outlook, there are three pressures that will keep rates structurally lower.
- Lower GDP Growth. Conceptually, trend GDP growth is a key determinant of long-term interest rates (Note: other determinants include a time preference factor that captures the relative attractiveness of saving and investment as well as monetary policy). The theoretical argument is simple.
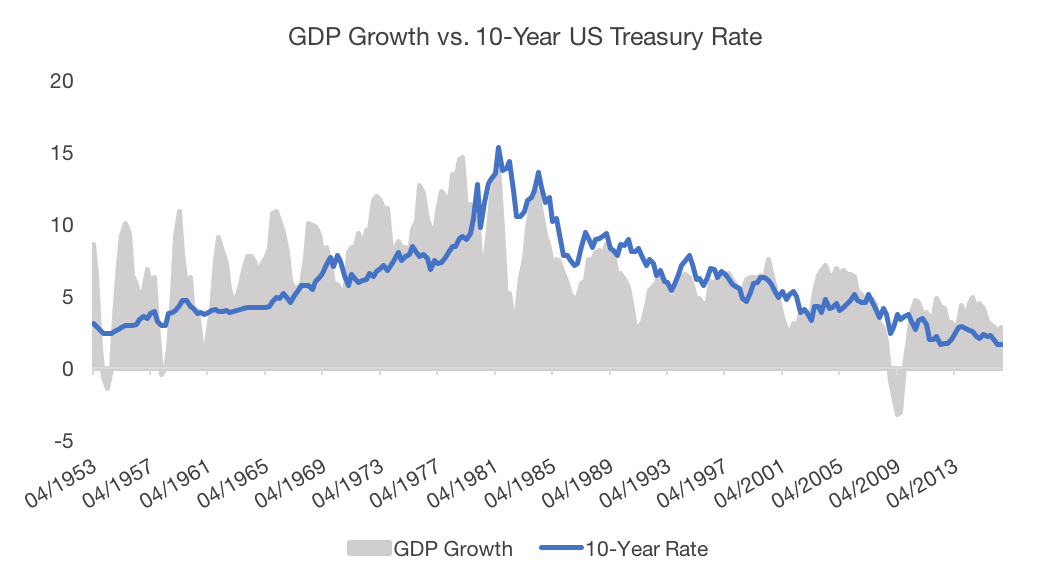 Source: St. Louis Federal Reserve.Calculations by Newfound Research.If GDP growth is higher than interest rates, then investors, in aggregate, should borrow more, as they can reinvest and capture the spread between GDP growth and the debt payments they’ll owe. The increased demand to borrow should drive rates up to meet GDP growth.On the other hand, if GDP growth is less than interest rates, then investors will not want to borrow, as they will not be able to grow the capital fast enough to match the interest payments. A lack of borrowing demand will force lenders to cut rates to drive up interest.Together, we find that GDP growth and interest rates should, over the long run, orbit around one another.Generally, GDP growth is broken into two components: demographic growth and productivity growth.Productivity growth represents those advancements that make each worker more effective in their job: things like multinational free trade, automation, global travel and global communication.Demographic growth is driven by population booms and busts.In the US, the last 30-50 years was a golden combination of demographic growth and productivity growth, as the Baby Boomers entered the work force and we saw advancements in computer technology and globalization efforts.Today, the outlook is less rosy. Demographic trends are more or less set in stone and will be a drag on GDP growth going forward.Even if we assume the same productivity growth, we’re still likely to see a slowing GDP growth, causing structural downward pressure on interest rates over the next 10-30 years.
 - Negative Global Interest Rates. Over 1/3rd of global debt is trading at a negative yield today. With globalized markets, an increase in U.S. rates may represent an investment opportunity for foreign investors with negative rates at home. A continued increase of foreign interest in U.S. Treasuries would help to further suppress yield.
There may even be second-order effects to consider. Flows into U.S. Treasuries from international markets requires the purchase of U.S. dollars. An increasing dollar could put continued pressure on the earnings for U.S. multinational companies who are generating revenue abroad. Decreasing earnings growth is a contributor to decreasing GDP growth, which brings us back to point #1 while also potentially slowing the pace of monetary tightening. - The Maturity Structure of Debt. Today, over 25% of marketable debt issued by the U.S. Treasury will mature in the next 12 months. Over 50% matures in the next 36 months [1]. To pay off these obligations, the U.S. Treasury will have to issue more debt.When issuing debt, the Treasury faces a trade-off. Issuing more debt on the short-end allows them to finance at lower interest rates (since they do not have to compensate for term risk), and refinance at a lower cost if rates fall. On the other hand, longer maturities can help smooth fiscal shocks and insure against rollover risk (i.e. longer maturities lock-in financing costs, which may be advantageous in a rising rate environment).Given the significant amount of roll-over that must occur in the next 36 months, it is worth contemplating how much pressure the U.S. Federal Reserve really wants to put on the Treasury.A significant hike over that period would reflect a potentially massive increase in the cost of servicing that debt.
We believe that these combined pressures may help create structural downward pressure on U.S. interest rates over both the short- and long-term.
The Risk of Low Rates
While investors may prefer declining interest rates, it is worth noting that low interest rate levels, in and of themselves, may represent a significant risk to traditionally allocated portfolios.
- Low rates mean lower expected returns. With the massive focus investors place on interest rate changes and bond portfolio returns, many might be surprised to find that the returns of a constant maturity bond portfolio can be fairly accurately estimated by the starting yield. For example, buying a constant maturity 10-year U.S. Treasury portfolio today with a yield of approximately 2.5% will likely lock in an annualized return close to 2.5% over the next decade.
- Could low rates mean less “crisis alpha”? Historically, U.S. Treasuries have exhibited a significant and persistent “flight to quality” return, whereby in an economic crisis investors flock to the safest asset, driving up its price. Investors already holding this asset benefit from the price bump, often offsetting losses in other parts of the portfolio.When rates are low, however, this crisis alpha opportunity may be muted. After all, rates and bond prices are inversely related. For bond prices to continue to climb, rates must fall. In a low rate environment, then, rates may have to go negative in a crisis for bonds to offer significant crisis alpha.
With these two points in mind, despite the short-term pain, higher rates may actually be a blessing to asset allocators.
Conclusion
Many investors are concerned about the potential damage that rising rates may play on their fixed income portfolio. We believe that many of these fears are unsubstantiated, particularly in constant maturity bond indices.
While rate changes can cause short term profits and losses, they also change the coupon yield that constant maturity portfolios reinvest at, which can largely offset short-term losses over multi-year periods. So for investors with a medium-to-long-term outlook, the initial rate that they invest at likely has more impact on their long-term returns than the rate changes they experience while they are invested.
Nevertheless, we believe that investors who remain concerned about fixed income and rising rates should consider why they are using fixed income in the first place.
If they are using it to manage risk, they might consider how other strategies may help play a role while simultaneously diversifying their portfolios away from interest rate risk. Our presentation The State of Risk Management explores how approaches like managed futures, low volatility equities, tactical equity, risk parity, and options can be used as risk management techniques.
For investors using traditional fixed income for yield, we believe that it may be prudent to expand the investment universe to include higher-income asset classes like high yield, bank loans, and emerging market debt.
We also think a focus on portfolio diversification and risk-adjusted yield can help create a more consistent income stream with less interest rate risk. We put this methodology into play in our Target Excess Yield portfolio suite.
Generally, for fixed income today, we advocate for an unbundle and rebuild philosophy.
Client Talking Points
- Increasing interest rates can cause short-term portfolio volatility, and even losses, but it also represents the opportunity to generate more income in the future.
- While the short-term volatility may not be fun, over the long-run, bond portfolio returns have historically been driven more by coupon yield than rate changes.
1. Source: https://www.treasury.gov/resource-center/data-chart-center/quarterly-refunding/Pages/Latest.aspx
Copyright © Newfound Research