For this week’s Equity Leaders Weekly, we are going to take a look at the broad Canadian Equity Market, through the S&P/TSX Composite Index (TSX.I), which has continued its upwards trend into December. We will also be relooking at the 30-Yr Interest Rate Yield as its continued rise has led to dramatic shifts in the long-term bond market since the U.S. election that are important to continue to monitor.
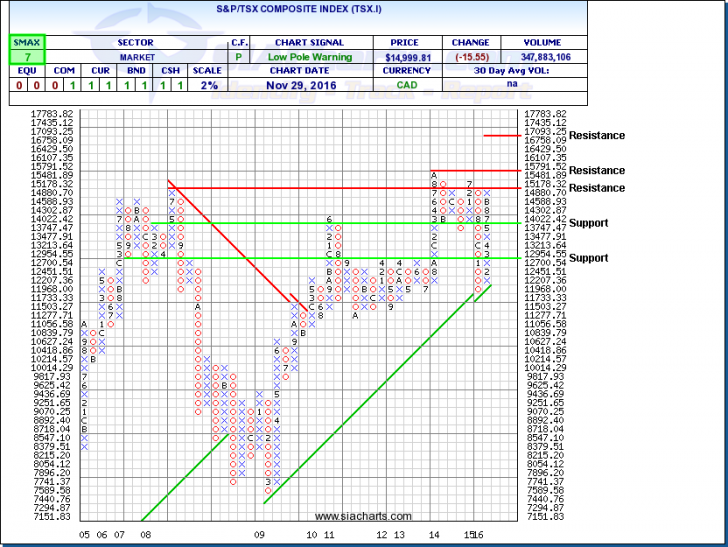
S&P/TSX Composite (TSX.I)
Last week when we highlighted all the main U.S. Equity indices were moving to new all-time highs, Canadian equities were rising to YTD highs and moved above 15,000 for the first time in over a year. Yesterday, rumors are that OPEC will reduce production by 1.2 million barrels a day of crude oil to 32.5 million a day. This announcement caused Crude Oil to surge around 7% initially with Energy stocks and funds following suite. Taking a longer-term view, Oil has still been trading in the $40 to $51 trading range highlighted in past commentaries and continued volatility in the sector is expected and if OPEC can’t come to an agreement, you could see a dramatic fall in oil prices to the lower $40s. Surprisingly, the USDCAD relationship remained virtually unchanged with the rise of Oil prices.
Looking back at the S&P/TSX Composite Index (TSX.I) chart, the index has been in a column of X’s on a 2% scale since late January and has now moved up against the 15,178 resistance level, which reflects the high of the TSX.I from back in July of 2008. A move through this level provides a major resistance level at its prior highs at the 15,791 level. What could help it reach this level is reports that per Statistics Canada, Canada posted its strongest economic growth in more than two years in Q3 as GDP rose 3.5% after Q2 saw a revised 1.3% GDP loss. It will be important to keep an eye on the Bank of Canada’s rate decision next week to see if the Government will change rates in light of any of this new information, but most likely won’t overreact to any short-term moves and news as it takes a longer-term approach to Canada’s economic outlook. To the downside, support is found for the TSX.I at 13,747 and at 12,700 should a reversal happen.
Click on Image to Enlarge
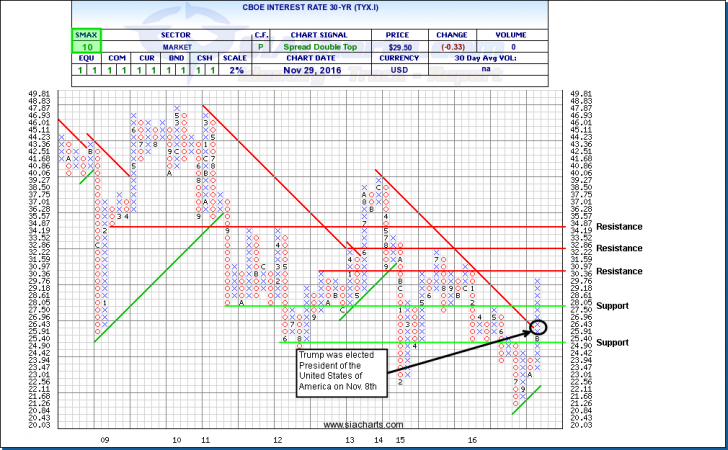
CBOE 30-Year Interest Rate (TYX.I)
We last looked at Treasury yields just three weeks ago, but after the Presidential vote, U.S. interest rates have continued to rise driving down bond prices, especially influencing the long-term bonds that may be most affected by these rising rates. The aftermath of the election and future policy implications going forward will have major influences not only on the 30-Year interest rate yield, but also the relative strength rankings of various duration and credit quality fixed income investments both within the US universe but also on an international scale.
If interested, SIACharts Support Staff can help you with some ideas to create your own Fixed Income sandbox of ETFs or Mutual Funds. Something worth considering might be to run that analysis in your portfolios at a lower percentage such as 2% or 3% so you can actively adjust a bond portfolio or to track accelerated changes in strength to the Bond universe for your clients. Please feel free to contact us for questions or help creating this in your profile or if you are interested in learning more about products that use relative strength to do this already.
The column of X’s that started in October for the CBOE 30-Yr Interest Rate (TYX.I) has continued since its breakthrough of the long-term trend line, which has been in place since 2013, that also happened around the U.S. Election as the chart shows. The new rally we're witnessing is now approaching the resistance levels we have highlighted before that are found around 3.097% and 3.29%, which is the high from 2015. Support to the downside is now found at 2.75% and at 2.49%. The TYX.I does have an SMAX score of 10 out of 10 showing near-term strength.
Click on Image to Enlarge
SIACharts.com specifically represents that it does not give investment advice or advocate the purchase or sale of any security or investment. None of the information contained in this website or document constitutes an offer to sell or the solicitation of an offer to buy any security or other investment or an offer to provide investment services of any kind. Neither SIACharts.com (FundCharts Inc.) nor its third party content providers shall be liable for any errors, inaccuracies or delays in content, or for any actions taken in reliance thereon.
Copyright © SIACharts.com