
by Jodie Gunzberg, Global Head of Commodities and Real Assets, S&P Dow Jones Indices
In October, the S&P GSCI Total Return (TR) lost 1.5% but the Dow Jones Commodity Index (DJCI) TR gained 0.1%. The performance disparity was mainly due to the weighting difference in energy since crude oil in the indices slid near 10% from its mid-month high, on doubts over OPEC’s ability to agree on production cuts and the report from the American Petroleum Institute (API) showing U.S. crude stocks rose by 9.3 million barrels in the last week.
Performance was split with positive total returns from 3 of 5 sectors and 10 of 24 commodities. Livestock gained 4.2%, the most of any sector, and precious metals lost 3.8%, the most of any sector. Energy, industrial metals and agriculture returned -3.5%, 1.1% and 2.4%, respectively. Despite the strong month for livestock, it is down 18.4% year-to-date – that is the sector’s 2nd worst year on record going back to 1970, only behind 2008, when it lost 22.8% through Oct. YTD. Also, energy and industrial metals are up 4.9% and 12.5% Oct YTD, respectively that is the most since 2009. Agriculture and precious metals are up 1.3% and 20.2% Oct YTD, positive year-to-date through Oct. for the first time since 2012.
Lean hogs performed best of all the single commodities, gaining 9.1%, giving pork producers something extra to celebrate this October along with their already designated “Pork Month“. On the other hand, silver performed the worst, losing 7.4%, mostly from the dollar strength and growth optimism that happened at the beginning of the month. Despite this, it is still having its 6th best Oct YTD (+27.6%) going back to 1974, and is on pace for its best year since 2010. (Zinc is also having a record year so far, up 51.3% Oct. YTD, its 3rd best in history since 1992, only behind 2006 and 2009.) If the dollar falls, silver may be one of the most positively impacted commodities, gaining on average about 6% for every 1% fall in the US dollar. Moreover, election uncertainty may drive the precious metals even higher as investors flee to the safe-haven metals, much like they did around the relatively recent events of Brexit, the Chinese stock market volatility and last Fed rate hike.
While volatility and fear generally have supported gold around election uncertainty (in fact, this year through Oct. gold in the index is posting its 6th best year ever going back to 1979 (+19.3%) and is on pace for its best year since 2011,) gold does significantly better under the historical Democratic presidencies, adding 24.3% on average in Democratic terms versus Republican ones since 1978. Like gold, most commodities do better on average under Democratic rule, but the majority of highs and lows for commodities are under the Republican presidencies. Of the 24 commodities, 14 have had their best performance and 18 have had their worst performance with Republican presidents. However, 17 single commodities have had better performance on average under Democratic Presidents. Although all sectors do better on average under Democratic presidents, all the commodities inside the S&P GSCI Grains including corn, wheat, Kansas wheat and soybeans do better under Republican presidencies.
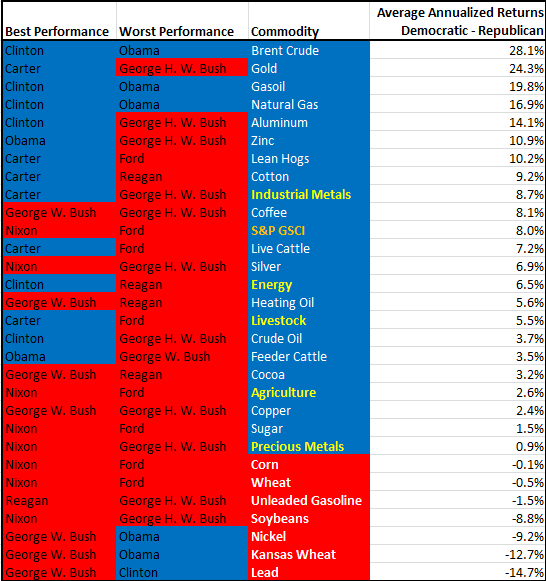
Source: S&P Dow Jones Indices
This article is a publication of S&P Dow Jones Indices LLC. © S&P Dow Jones Indices LLC 2016. S&P® is a registered trademark of S&P Financial Services LLC. Dow Jones® is a registered trademark of Dow Jones Trademark Holdings LLC. S&P Dow Jones Indices LLC is not an investment advisor. This publication is not a recommendation by S&P Dow Jones Indices to buy, sell, or hold a security, nor is it considered to be investment advice.
Copyright © S&P Dow Jones Indices