This week for the SIA Equity Leaders Weekly, we are going to analyze the strong bounce taking place in the 30 year interest rate yield by looking at the CBOE 30 - Year US Treasury Yield Index, and second, look at and discuss the related changes in the USDCAD currency chart.
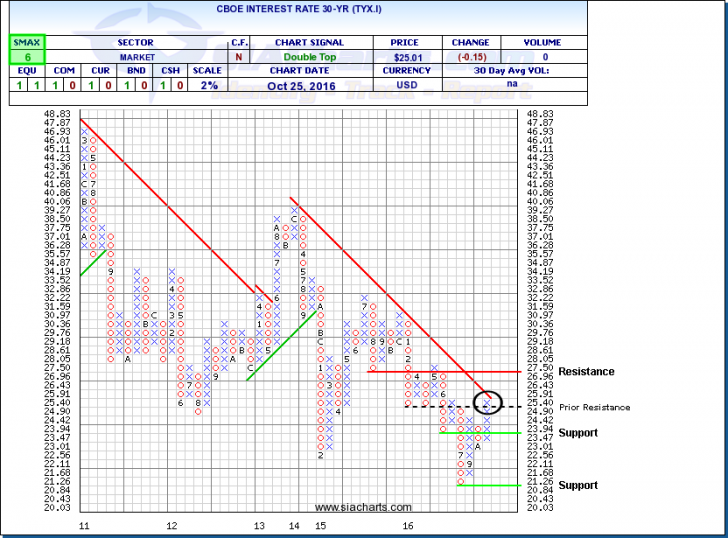
CBOE Interest Rate 30-yr (TYX.I)
We last looked at Treasury yields in late July and before that a little over a month prior, where the TYX.I was approaching resistance at 2.39% and then at the 2.5% level. The market reaction in late June to Brexit pushed yields to record low levels with the 30-yr yield moving as low as 2.13% before bouncing. This new rally we're witnessing in the 30 year yield has made its way all the way up to the downtrend line which began in late 2013, and those past resistance levels are now new support areas. Whether or not further strength will ensue, most likely causing a reversal in the long-term downtrend. it will probably be on hold until after the US Presidential election next month.
As a reminder in late July, as most expected, the Federal Reserve chose to leave the Fed Funds rate at 0.25-0.5% after their meeting saying they will “closely monitor inflation indicators and global economic and financial developments” as to what they will do next. Recent economic data in the U.S. has been pointing to a strengthening U.S. economy, but it seems they have yet to see everything they need to increase rates. The implications going forward will have major influences not only on the 30 year interest rate yield, but also the relative strength rankings of various duration and credit quality fixed income investments both within the US universe but also on a international scale.
Click on Image to Enlarge
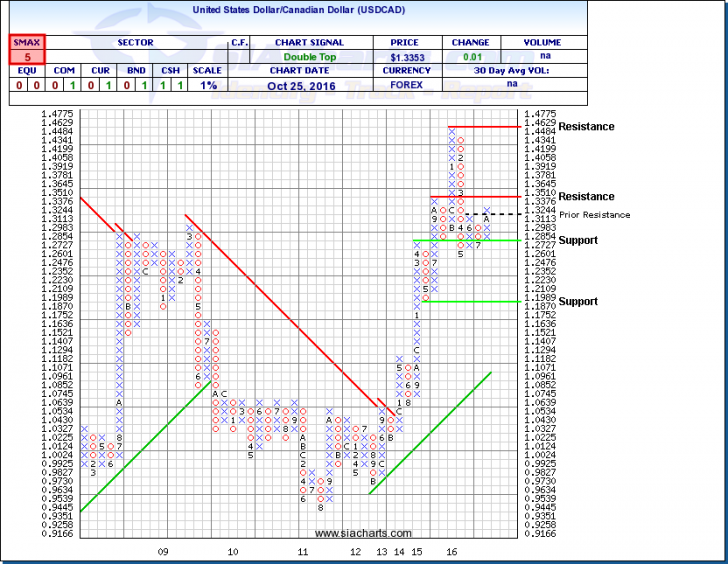
United States Dollar/Canadian Dollar (USDCAD)
Since last looking at the USDCAD comparison chart back on the July 21 edition of the Equity Leaders Weekly, the greenback has finally made its way past strong resistance at $1.3244 and onto seven month highs. This took place a couple of weeks ago when the US retail sales data gave additional ammunition for the case of higher interest rates this year, while at the same time Janet Yellen's subsequent speach did little to alter that view.
As mentioned above, any changes from the US Federal Reserve is unlikely to happen ahead of the US Presidential election but when they do meet afterwards, the implications going forward will have major influences not only on this currency pair, but also the relative strength rankings of Canadian equity versus US Equity.
The next significant resistance level is seen at the $1.35 which if broken could open the possibility to again seeing the $1.40 levels. However, to the downside, immediate support if broken at the $1.27 level could allow for further US dollar weakness below $1.20.
For a more in-depth analysis on the relative strength of the equity markets, bonds, commodities, currencies, etc. or for more information on SIACharts.com, you can contact our customer support at 1-877-668-1332 or at siateam@siacharts.com.
Click on Image to Enlarge
SIACharts.com specifically represents that it does not give investment advice or advocate the purchase or sale of any security or investment. None of the information contained in this website or document constitutes an offer to sell or the solicitation of an offer to buy any security or other investment or an offer to provide investment services of any kind. Neither SIACharts.com (FundCharts Inc.) nor its third party content providers shall be liable for any errors, inaccuracies or delays in content, or for any actions taken in reliance thereon.