
by David B. Mazza, State Street Global Advisors
The third-quarter corporate earnings reporting season got off to a lousy start as Alcoa, which is seen as a bellwether for industrial demand, reported lower-than-expected earnings and the S&P 500® Index promptly fell 1.2%.1 The swift reaction illustrates how dependent the seven-year bull market run has become on earnings growth to propel it higher given the absence of strong economic growth.
Despite this shaky start, investors may be in for a positive October Surprise when it comes to earnings. Every month, our ETF and Mutual Fund Research team pulls together key charts that capture investment trends evolving beneath the surface. The charts we are sharing this month illustrate how trends in recent quarterly earnings indicate that we may actually end the third quarter with better-than-expected results that could propel markets higher.
The prolonged corporate earnings recession
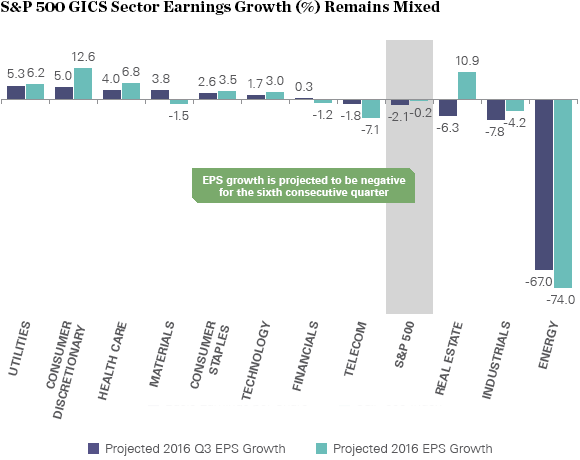
Wall Street analysts are currently forecasting a sixth consecutive quarter of negative earnings-per-share (EPS) growth.2 As shown in the chart below, four out of 11 sectors are projected to have negative EPS growth with energy continuing to be the primary drag on overall index level earnings.
At the same time, a contraction in manufacturing is challenging the industrials sector, while large multi-nationals that produce a significant amount of revenue overseas—such as telecom and consumer discretionary companies—are still feeling the pressure of a strong US dollar.
Source: FactSet, State Street Global Advisors, as of 9/30/2016
Could the third quarter mark an end to the corporate earnings recession?
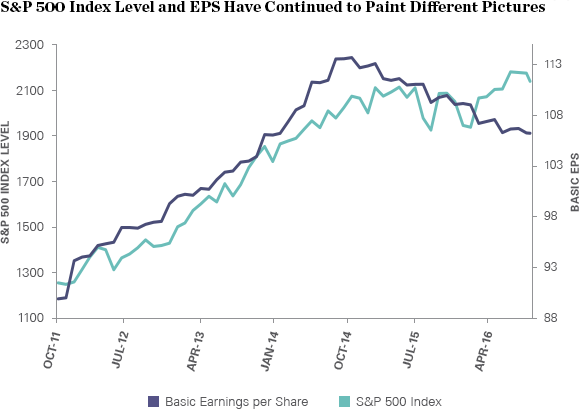
Since it generally takes two consecutive quarters of negative economic growth to indicate an economic recession, two quarters of year-over-year earnings growth can be viewed as an earnings recession.3 That means the US has been mired in a corporate earnings recession since the second quarter of 2015—the longest earnings recession since 2008-2009.4
Source: Bloomberg Finance L.P., as of 9/30/2016
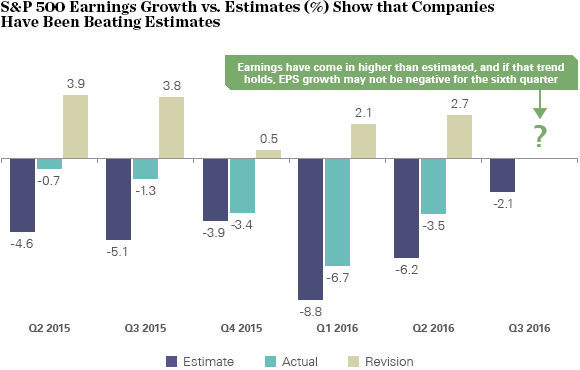
However, as captured in the chart below, we’ve seen earnings reports come in better-than-expected every quarter since the second quarter of 2015, and earnings estimates have been revised in anticipation of higher performance.
Source: FactSet, State Street Global Advisors, as of 9/30/2016
Part of the reason for better-than-expected earnings is that analysts’ EPS estimates are often guided by companies, which tend to follow the old adage of “under-promise and over-deliver” when it comes to earnings.
At the same time, third-quarter earnings are, on average, expected to decline 2.1%. This is a more modest decline in year-over-year earnings growth than has been forecast in any of the past five quarters. If the trend of companies under-promising and then over-delivering holds, third-quarter earnings have the chance to flip into positive territory.
Ending the earnings recession could act as a positive October Surprise—setting the stage for potentially higher US stock prices even with politics dominating the news flow and the Federal Reserve potentially on the move.
For more market commentary and investment insights, you can access our monthly Chart Pack. It provides additional views into how investors are positioning given the market’s recent movements, including a look at investor confidence as Election Day approaches and the presidential election’s impact on the market.
1Bloomberg Finance L.P., as of 10/11/2016
2Earnings per share estimates based on consensus earnings forecasts from analysts polled by FactSet, as of 9/30/2016
3National Bureau of Economic Research
4FactSet, as of 9/30/2016
Definitions
Earnings Per Share (EPS)
A profitability measure calculated by dividing a company’s net income by the number of shares outstanding.
S&P 500 Index
The S&P 500, or the Standard & Poor's 500, is an index based on the market capitalizations of 500 large companies having common stock listed on the NYSE or NASDAQ. The S&P 500 index components and their weightings are determined by S&P Dow Jones Indices.
Copyright © State Street Global Advisors