
How to Sandbox Top US Dividend Stocks by Momentum and Growth At A Reasonable Price
With Baby Boomers in the early stages of retirement or approaching retirement, the shift is just beginning from accumulation to distribution.
As a portfolio manager or advisor, you need to identify stocks that can provide your clients with high levels of dividend income and low levels of risk. In today’s article, I am going to walk through the steps of how to screen for high dividend stocks that fit this profile.
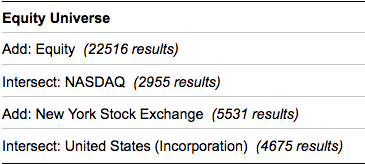
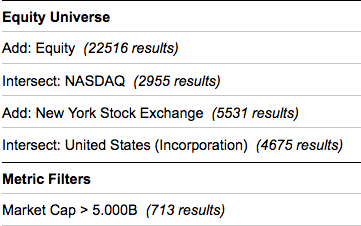
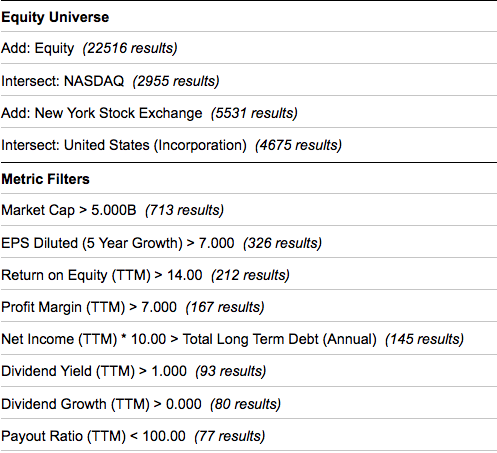
To start, we need to select our broad investment sandbox. For this example, we are focusing on stocks listed on the New York Stock Exchange and NASDAQ. To avoid international stocks (ADRs), we have selected only stocks incorporated in the US. This broad screen gives us a significant number of stocks with which to work.
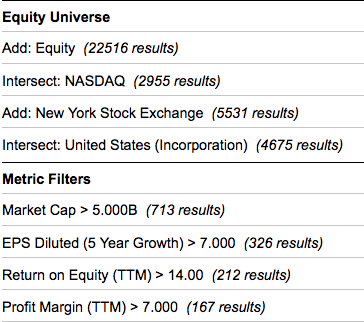
One factor that is often overlooked by investors is dividend growth. To achieve sustainable dividend growth, a company needs to grow its earnings. So we are going to start with EPS Growth greater than 7% annually over the past five years.
Next, we screen for companies with ROE greater than 14% and profit margins greater than 7%.
This screen tightens our list down to 167 companies.
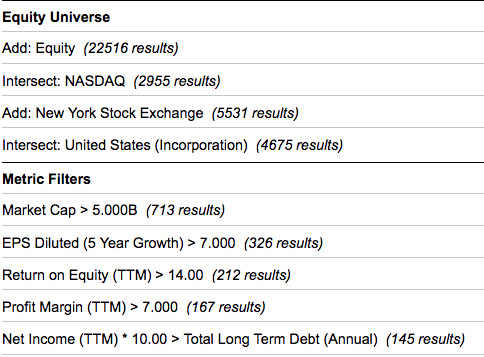
On average, this group of companies have paid dividends of 2.1%, have grown their dividends by 3.1% and have provided shareholders with a return of 17% over the past year.
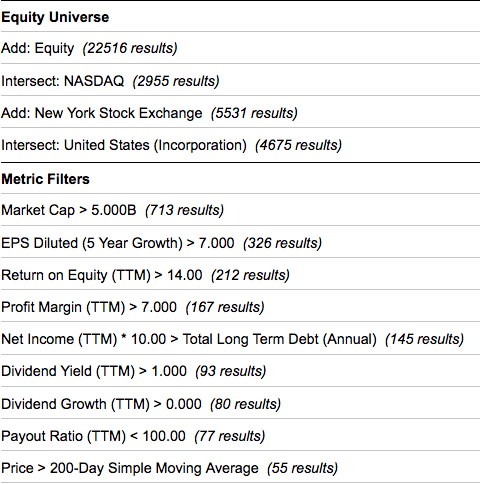
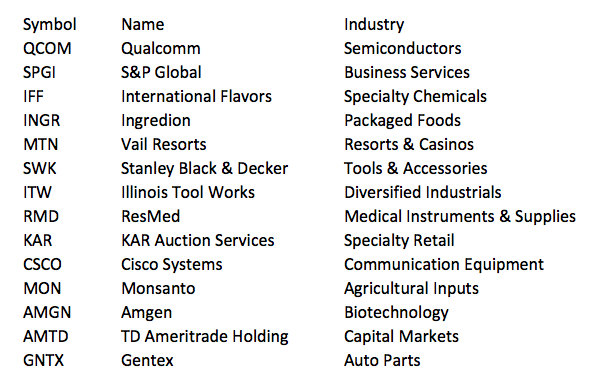
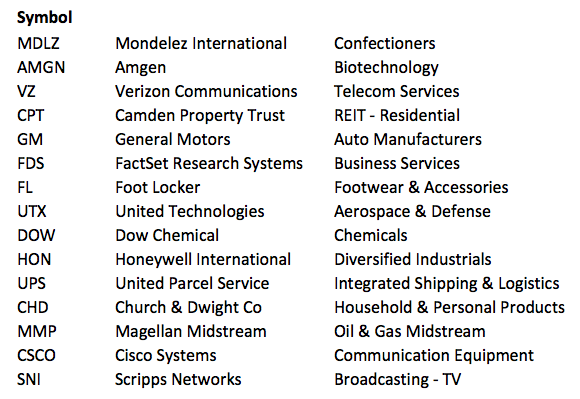
The final step in our process is stock selection. You have a variety of ways of choosing stocks from this list. Let’s assume; you want to build a portfolio of 14 stocks in 14 different industries. We could select stocks that are in an uptrend if you define uptrend as trading above its 200-day moving average. Adding this factor brings us down to 55 companies. Then you could rank the companies, based on 6-month total return and choose the top 14 stocks. This would produce a multi-factor momentum strategy:
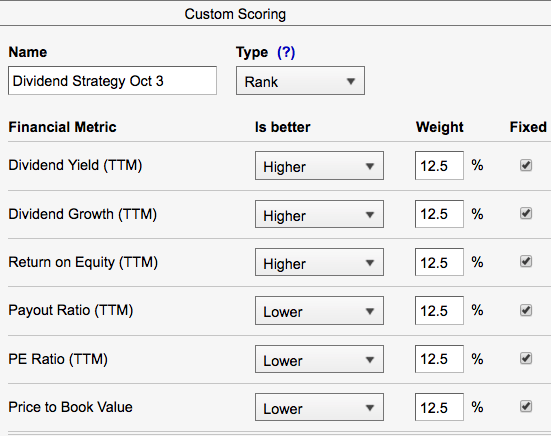
These are simply examples to help you see how you can build a screen and build your sandboxes. There are hundreds of fundamental and technical factors that you can use for screening and build your ideal scoring system. The screens are current as of October 3, 2016.
To learn more, watch the replay of this week’s Huddle at http://www.synchronicity.ca/the-huddle.html
Copyright © Synchronicity Performance Consultants