
We are taking a commodity focus this week in the Equity Leaders Weekly. We are going to re-examine the Crude Oil Continuous Contract (CL.F) in light of OPEC's meeting yesterday which resulted in an agreement to curb the global oil supply glut and also take another look at a comparison chart of the Gold Continuous Contract (GC.F) versus Gold Equities in the Van Eck Gold Miners ETF (GDX) to see how the relationship between the two has evolved over the last couple of months.
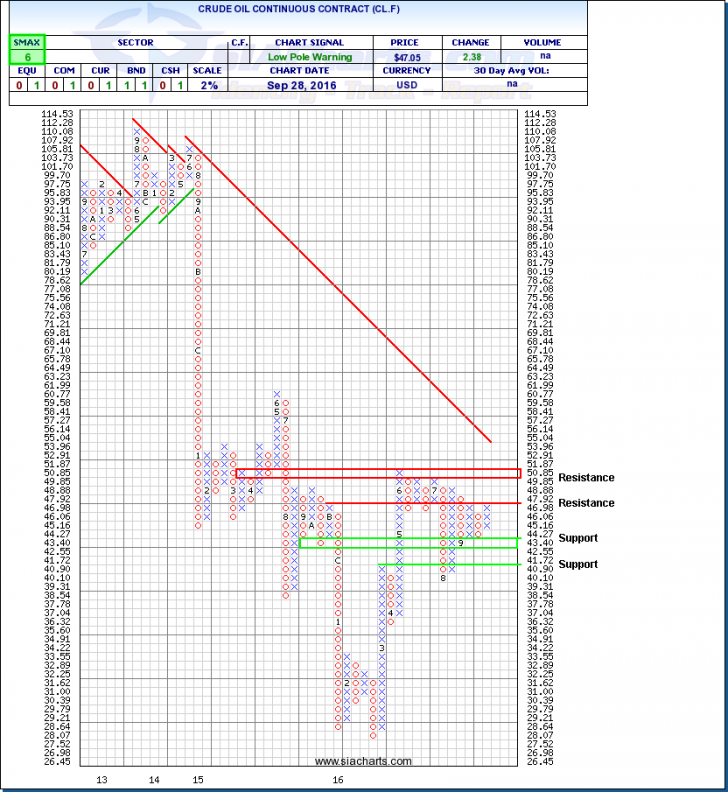
Crude Oil Continuous Contract (CL.F)
Yesterday in Algiers, Algeria, the Organization of Petroleum Exporting Countries (OPEC) has finally come to an agreement that they need to cut crude production in order to reduce the global supply glut. This decision was enough to make oil prices jump 5.33% on the day to close at $47.05/bbl, even though the logistics of a deal are still unclear. It took six hours for the group to reach an understanding, however OPEC has deferred the task of finalizing the plan until their next meeting on November 30th in Vienna. This marks the first time since oil prices began to collapse two years ago that the cartel has collectively agreed that action needs to be taken in order to get global supply under control, but we will have to wait until November to see what that action looks like.
In the mean time we can take a look at the Crude Oil Continuous Contract (CL.F) which just formed a three box reversal and is nearing resistance at $47.92, a move through this level could see further resistance come into play around $50. Crude just bounced off of support levels at ~$43, below this level CL.F has further support at $40.90. We could see continued range bound trading for oil as nothing fundamentally will change on the supply side until the next OPEC meeting. With an SMAX of 6 out of 10, CL.F is showing some near term strength versus the asset classes.
Click on Image to Enlarge
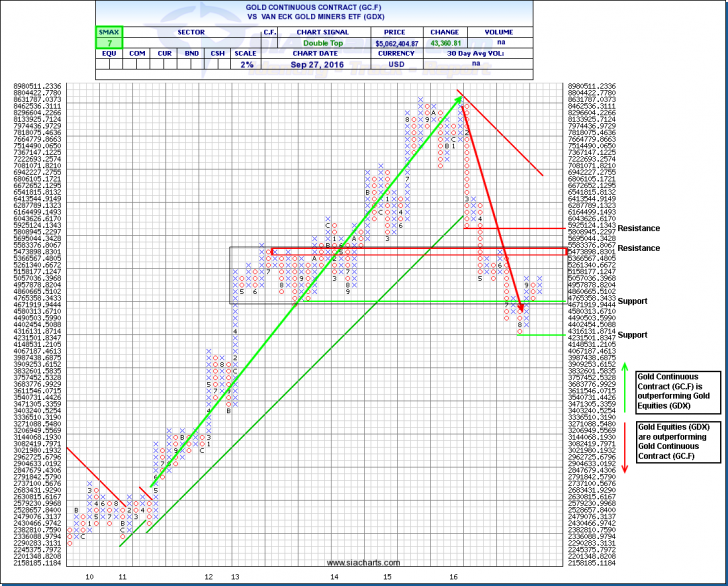
Gold Continuous Contract (GC.F) vs. Van Eck Gold Miners ETF (GDX)
To do an analysis of gold, the commodity and safe haven asset, versus gold equities and understand where the strength lies in the relationship between the two we will revisit a comparison chart that we have used in the past comparing the Gold Continuous Contract (GC.F) vs. Van Eck Gold Miners (GDX). As a reminder, and ascending column of X’s represents outperformance in GC.F vs. GDX and a descending column of O’s represents outperformance of GDX vs. GC.F. The last time that we looked at this relationship back in May 2016, we commented on the change in leadership from the commodity, which dominates from 2010 through 2015 as indicated by the green upwards arrow and trend, to the gold equities since the beginning of 2016 as indicated by the red downwards arrow and trend.
In looking at the chart we can see that there has been a bounce off of the strong downtrend which favors equities showing some shorter term strength in the commodity over the equities. This isn’t surprising as we did see a bit of a pull back in gold equities throughout August as some took profits from the run in the gold equities space as it significantly outperformed the strength in the commodity. The chart can also give us an idea of where the market begins to price in value of the commodity over the equities, and vice versa. Should the strength continue in GC.F over GDX we can see that there is some resistance coming into play as indicated by the red lines at the top of the black box, however should this trend reverse there is also some support to the downside, as highlighted by the green support lines. There is potential for this relationship to become range-bound as traders and investors identify levels where they feel the commodity or the equities are undervalued relative to the other and the trend reverses. A breakout to the top of the black box trading range could signal further strength to the commodity, however a reversal and breakout to the lower end of the trading range signals strength to the equities. With a VS SMAX of 7 out of 10, GC.F is winning the shorter term relative strength battle vs. GDX.
For a more in-depth analysis on the relative strength of the equity markets, bonds, commodities, currencies, etc. or for more information on SIACharts.com, you can contact our customer support at 1-877-668-1332 or at siateam@siacharts.com.
Click on Image to Enlarge
SIACharts.com specifically represents that it does not give investment advice or advocate the purchase or sale of any security or investment. None of the information contained in this website or document constitutes an offer to sell or the solicitation of an offer to buy any security or other investment or an offer to provide investment services of any kind. Neither SIACharts.com (FundCharts Inc.) nor its third party content providers shall be liable for any errors, inaccuracies or delays in content, or for any actions taken in reliance thereon.
Copyright © SIACharts.com