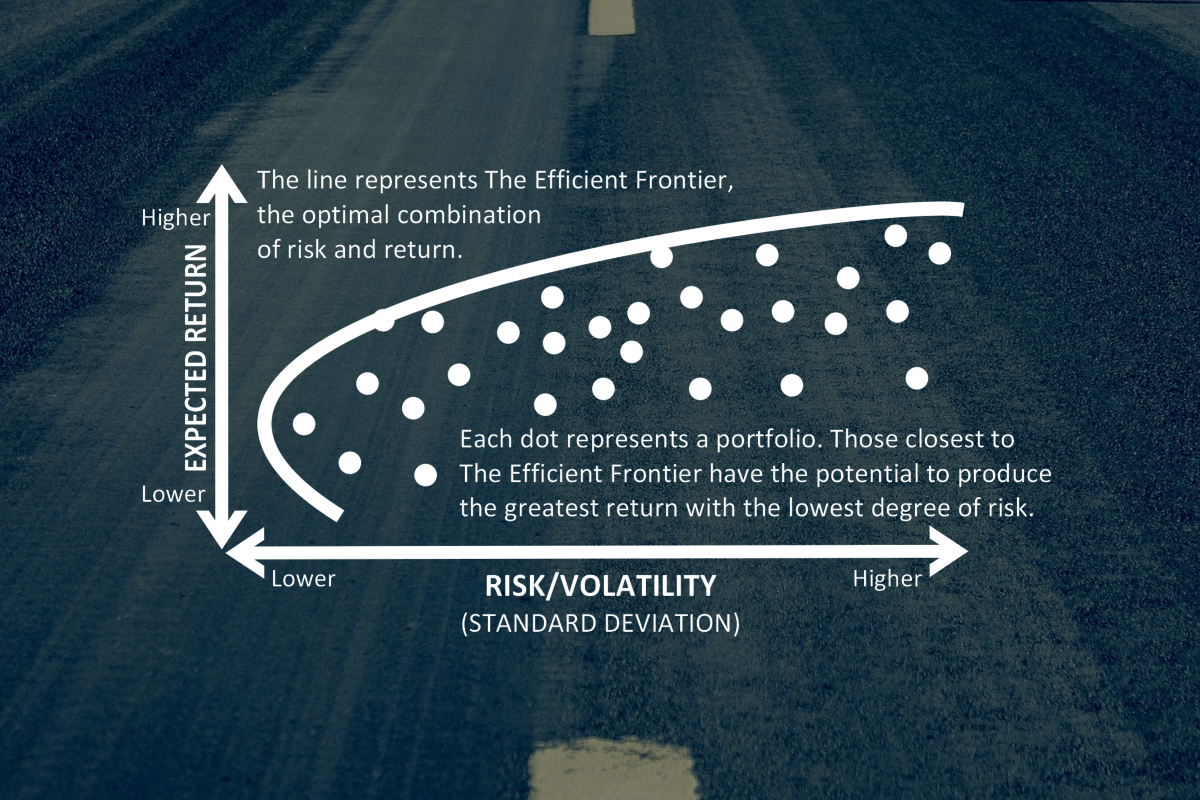
For this week’s edition of the Equity Leaders Weekly, we are going to re-examine the High Grade Copper Futures Contract and also the recently strengthening US Semiconductor sector. Both of these at various times in the past have been referred to as leading economic indicators, but as we will see the two are currently trending in opposite directions leaving an investor to wonder which of either are reliable barometers of things to come.
High Grade Copper Continuous Contract (HG.F)
Also known as Doctor Copper, the base metal is known to hold "a Ph.D in economics because of its ability to predict turning points in the global economy"; this "because of copper's widespread applications in most sectors of the economy - from homes and factories, to electronics and power generation and transmission - demand for copper is often viewed as a reliable leading indicator of economic health." But like many other 'rules of thumb', the price direction of copper as an investment indicator is not infallible and with many North American stock markets still in multi-year up trends, the indicator has been far from useful. If however we look to China, the world's biggest user of the metal, demand is slowing and firms such as Goldman Sachs are now predicting that this will cause the prices to drag even lower.
Speaking of price, copper had fallen steadily since the beginning of 2011, and when we last looked at Copper back in early February of this year there seemed to be no end to the slide. Since then, Copper has managed to find a bottom and for the past 6 months a consolidation and potentially bottoming formation ensued. This narrowing price action and the formation of a symmetrical triangle pattern (better seen on a candlestick chart) has some analysts warning that this supports a bearish longer term outlook suggesting that the probabilities favor a resumption of its longer term downtrend.
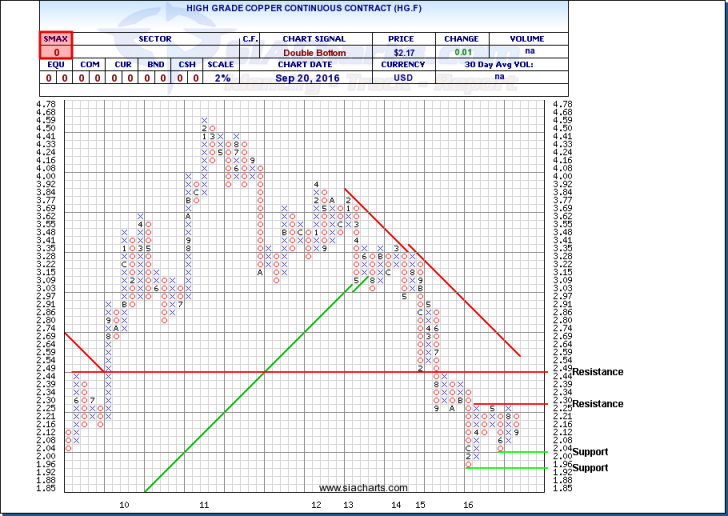
In looking at the chart of copper (HG.F), as mentioned we see that copper reached a bottom in February and has bounced minimally up to $2.30. This price level has proven to be a very stubborn new resistance area which has held firm for 3 unsuccessful attempts to breach; first in early March, then in April, and recently in mid-July. Currently to the downside we can see support at $2.00 and then lower at $1.92 potentially taking it to multi-year lows if broken. Time will tell, but with an SMAX of zero, displaying weakness against all of the asset classes, the prudent investor will wait on the sidelines rather than make a guess at this time.
Click on Image to Enlarge
iShares PHLX Semiconductor ETF (SOXX)
The semiconductor, comprised of silicon is a very small material product which conducts electricity and is found in products such as computers, cellphones, appliances, and medical equipment. Recently both individual companies and representative ETFs have been moving up the ranks in various SIA reports. For example, within ETF Sectors, and under the US Equity Specialty report you will see that the 4 top ranked names all come from the semiconductor space. One of these, the iShares PHLX Semiconductor ETF (SOXX) seeks to track the investment results of an index comprised of US equities in the semiconductor sector. These US companies that design, manufacture, and distribute semiconductors include names such as Intel, Texas Instruments, Qualcomm, Nvidia, and Broadcom. Historically seen as a volatile sector, since the beginning of the year, this index is up nearly 40%.
In the past, some analysts watch this sector as a possible leading indicator for economic growth. Whether the reliability of this sector's movements are just as fallible as the Doctor Copper gauge, the recent high correlation with the broad North American markets are uncanny.
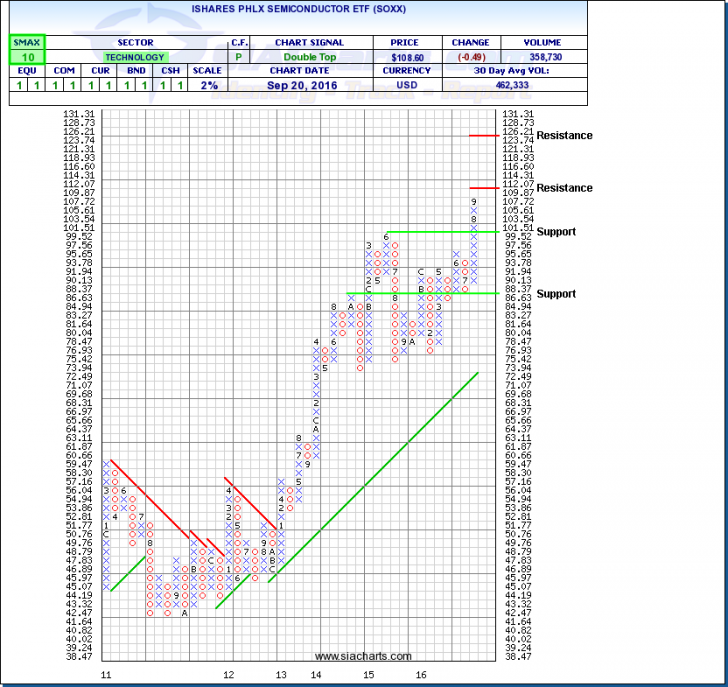
From the chart you can see that this index has been in a strong uptrend for nearly 4 years. Hitting new all-time highs this month, SOXX is closing in on resistance at $112 and beyond that at around the $125 mark. Support currently sits at $100 and then lower at around $85. With an SMAX of 10, we are seeing near-term strength against all of the asset classes.
The chart is a mirror image of the above copper one and if looking for a hint of things to come economics wise, they are telling us two completely different stories. Instead of relying on these sort of tea leaf predictors, here at SIA we rely on the relative strength rankings to help us participate in strength and avoid weakness; when change comes, we will rotate accordingly.
Click on Image to Enlarge
SIACharts.com specifically represents that it does not give investment advice or advocate the purchase or sale of any security or investment. None of the information contained in this website or document constitutes an offer to sell or the solicitation of an offer to buy any security or other investment or an offer to provide investment services of any kind. Neither SIACharts.com (FundCharts Inc.) nor its third party content providers shall be liable for any errors, inaccuracies or delays in content, or for any actions taken in reliance thereon.
For a more in-depth analysis on the relative strength of the equity markets, bonds, commodities, currencies, etc. or for more information on SIACharts.com, you can contact our customer support at 1-877-668-1332 or at siateam@siacharts.com.
Copyright © SIACharts.com