
For this week’s edition of the SIA Equity Leaders Weekly, we are going to revisit the Nasdaq Composite as the technology-driven index has moved to new all-time highs this week after breaking through strong resistance set a year ago. And these record highs are taking place despite near record lows in the CBOE Volatility (VIX) Index which we will also take a historical look at.
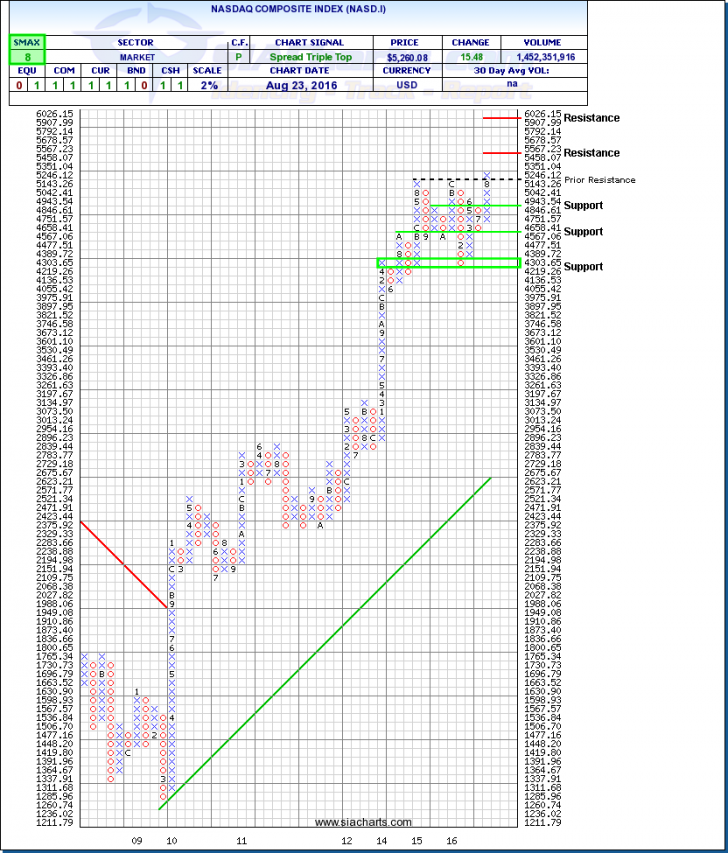
Nasdaq Composite Index (NASD.I)
We last looked at this chart back on July 12, 2016 where unlike the S&P 500 that had moved to new highs, the Nasdaq Composite Index had struggled to break through the 5000 psychological level and resistance at 5042. In mid-July that level was eventually broken and the momentum carried the NASD.I up to and through the strong (and now prior) resistance level of 5246. Closing on Tuesday at $5,260.08, the index is at a new all-time high level. Further strength should encounter resistance at new psychological areas, those being at the 5500 and 6000 levels.
Although the move this week seems to be a very bullish sign and chart pattern, occasionally these breakouts turnout to be false moves and lead to quick reversals. As cautioned when the S&P 500 made a similar major resistance breakout last month, we will watch anxiously for follow-through. The US markets still have many important events and decisions to react to namely the Presidential election, and as well the ongoing threat and/or speculation of the Federal Reserve raising interest rates. As witnessed with the US currency fluctuations, these many uncertainties will continue to weigh on market direction before longer term trends are realized.
Click on Image to Enlarge
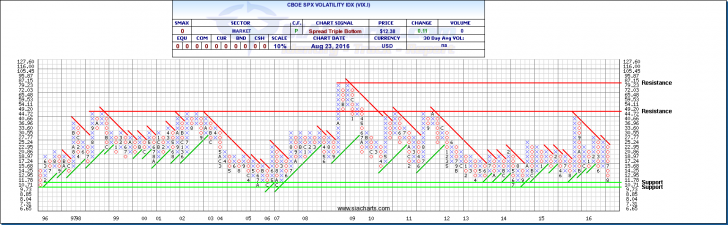
CBOE SPX Volatility Index (VIX.I)
Created in 1993, the Chicago Board Options Exchange (CBOE) Volatility Index (VIX) has become the most popular method of measuring expected volatility. The VIX shows the markets volatility expectations for the next 30 days and does this by tracking both Puts and Calls on S&P 500 index options. Volatility is a measure of how quickly or slowly prices change, and many investors watch this index for extreme volatility because it is generally believed that when the market hits these extremes, it reverses course. For some rules of thumb parameters, a VIX below 20 indicates calm market expectations, and above 30 signals high uncertainty and fear in the markets.
The attached chart gives a long term historical view of the VIX and the current reading well below that 20 line displays very calm market expectations with very little volatility. Though many of the major US market indices are witnessing new highs, their moves have been generally slow and steady; somewhat different and unlike past euphoric accelerated rallies.
For now, markets should continue to see low volume and low volatility until Federal Reserve Chair Janet Yellen gives her speech on Friday from Jackson Hole, Wyoming. She is scheduled to speak on the US economy and monetary policy which may turnout to be a non-event, but with the recent hawkish rhetoric from New York President William Dudley and Fed Vice Chairman Stanley Fischer, markets participants will be hanging on to every word.
For a more in-depth analysis on the relative strength of the equity markets, bonds, commodities, currencies, etc. or for more information on SIACharts.com, you can contact our customer support at 1-877-668-1332 or at siateam@siacharts.com.
Click on Image to Enlarge
SIACharts.com specifically represents that it does not give investment advice or advocate the purchase or sale of any security or investment. None of the information contained in this website or document constitutes an offer to sell or the solicitation of an offer to buy any security or other investment or an offer to provide investment services of any kind. Neither SIACharts.com (FundCharts Inc.) nor its third party content providers shall be liable for any errors, inaccuracies or delays in content, or for any actions taken in reliance thereon.