Technically Speaking: A Bull Market in Complacency
by Lance Roberts, Clarity Financial
On Monday, the markets hit new “all-time highs.” That’s the good news.
The bad news is that such is occurring on a rapid decline in volume as shown in the chart below.
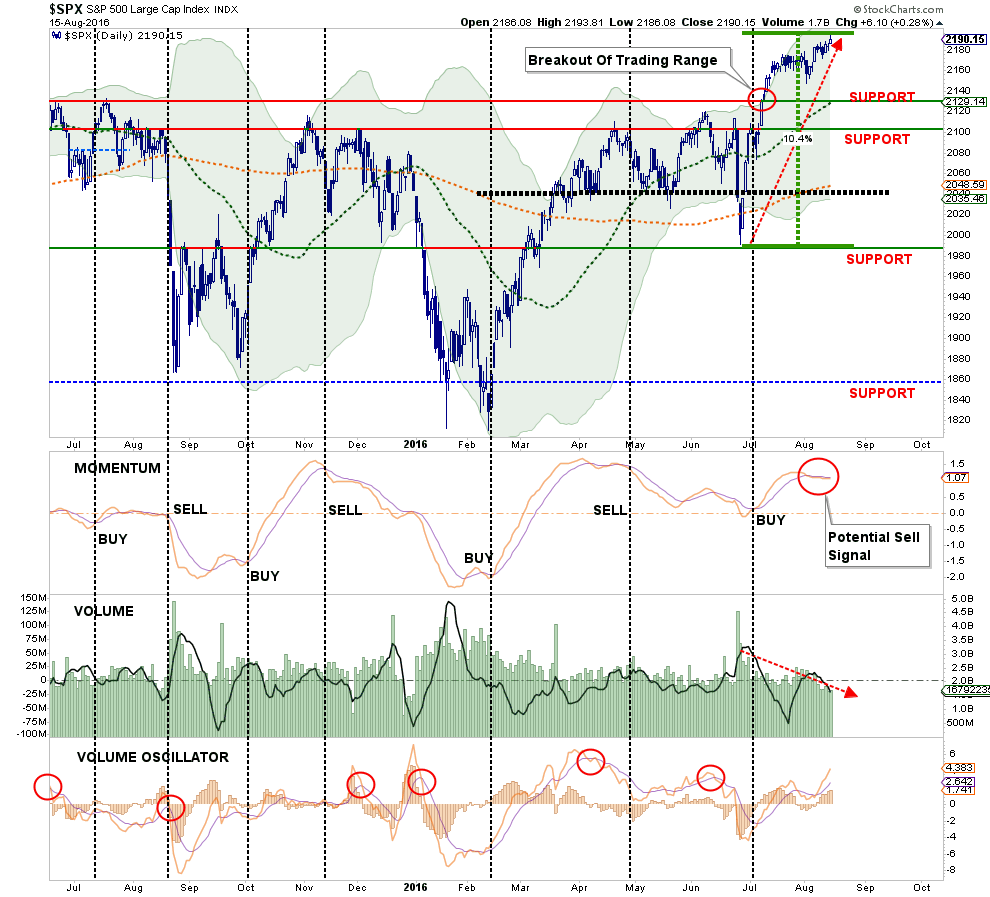
While volume by itself is not a great indicator from which to manage money by, it does lend credence to the level of participation in the market’s advance. Volume, like volatility which we will discuss in a moment, is most useful in denoting turning points in the market. Historically, volume tends to begin increasing just prior to, and during, a market decline.
While declining volume does not suggest the current advance is over, it is worth paying attention to when it turns higher.
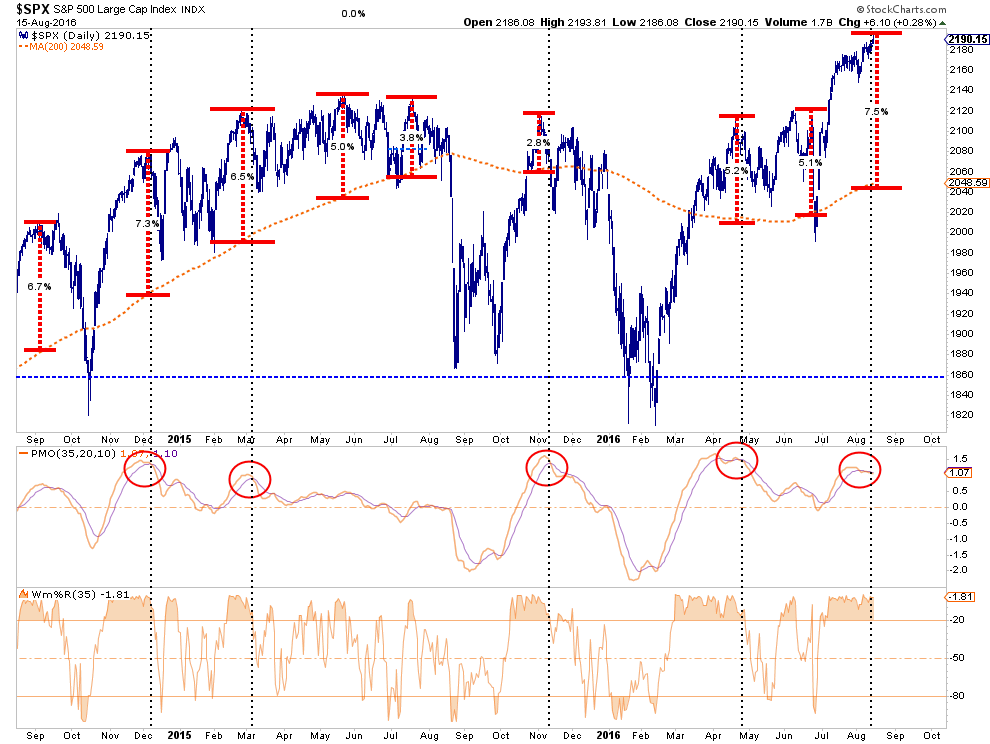
Furthermore, with the extension of the market now 7.5% above the 200-day moving average, a reversion at some point in the not-s0-distant future becomes much more likely. This is particularly the case given the current overbought conditions combined with weakness in price momentum from high levels as denoted by the red circles below.
But such “bear markings” seem to provide little worry to the “bulls” which brings me to my point for today.
A Bull Market In Complacency
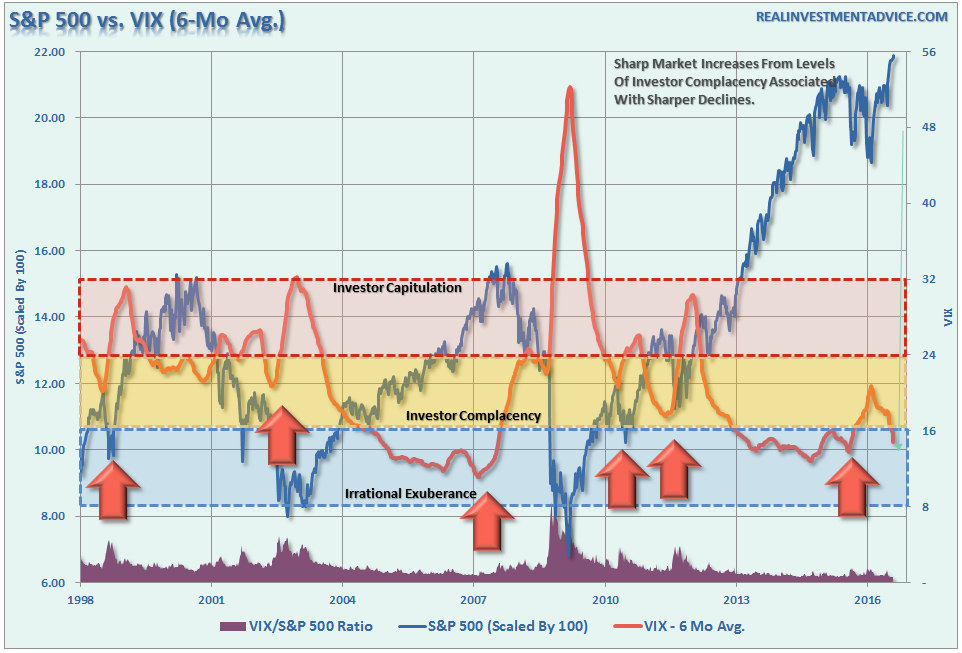
In this past weekend’s newsletter, I touched on the volatility index stating:
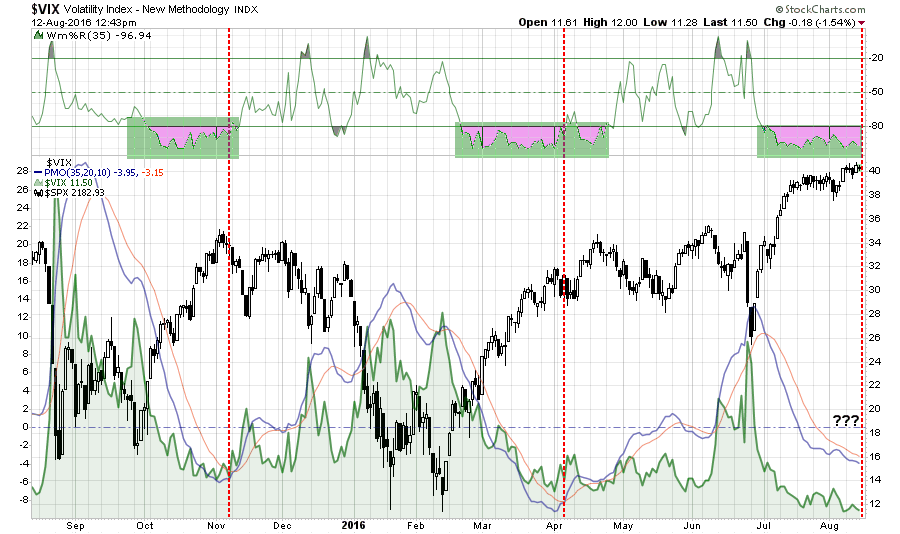
“The level of “complacency” in the market has simply gotten to an extreme that rarely lasts long.
The chart below is the comparison of the S&P 500 to the Volatility Index. As you will note, when the momentum of the VIX has reached current levels, the market has generally stalled out, as we are witnessing now, followed by a more corrective action as volatility increases.”
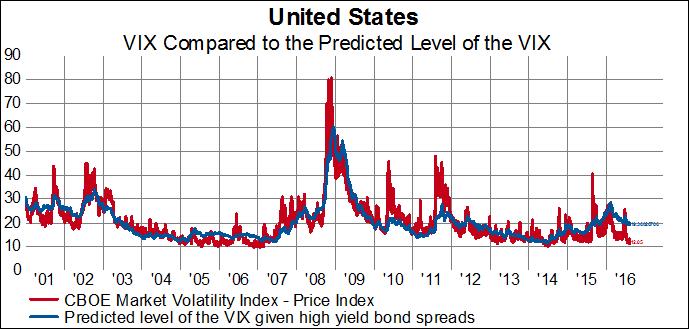
“The relationship between the VIX and the spread between high yield bonds over 10-year treasuries is highly correlated (87% over the past 15 years). This, of course, makes intuitive sense. The VIX tends to spike when confidence in stocks or the economy is shaky. Which is also true for high yield bonds. When investors begin to worry that high yield issuers won’t be able to make debt payments because of, for example, slowing growth, high-yield bonds usually sell off against treasury bonds.
The level of the VIX has fallen much further and signifies that fears in the equity market are much lower than fears in the bond market. At no point over the past 15 years has this level of the VIX occurred when high yield bond spreads are this elevated.”
More to this point, the chart below shows the S&P 500 as compared to the level of volatility as represented by the 6-month average of the Volatility Index (VIX). I have provided three different bands showing levels of investor sentiment as it relates to volatility. Not surprisingly, as markets ping new highs, volatility is headed towards new lows.
In my opinion, there seems to be a higher than normal probability that volatility will take a turn higher sooner rather than later. As such as I have added a net long position in portfolio betting on a rise to hedge against the coincident decline in my net long equity holdings at the current time.
For my, the question really isn’t “IF” it will happen, but simply “WHEN.”
This view was reinforced by Tyler Durden yesterday when discussed the record levels of speculative “short interest” on the VIX. To wit:
“Speculative bullish positions all added this week with VIX shorts and Dow longs now at all-time record highs.. and Nasdaq longs soaring…”
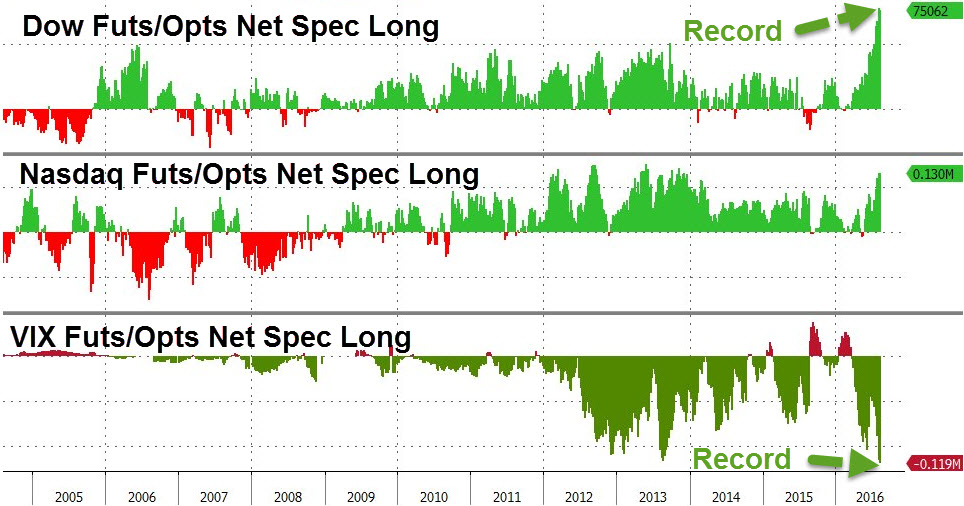
Importantly, it is worth noting the “record short” positions on the VIX are distorting the pricing on the various ETF’s that are designed to mimic the VIX. However, when those short positions begin to unwind, it will likely exacerbate the move higher of the VIX related ETF’s as short-covering fuels the buying spree.
With professional investors, as represented by the IINV Sentiment Survey, pushing more exuberant levels of bullishness the potential for a short-term reversal in the markets is more than elevated.
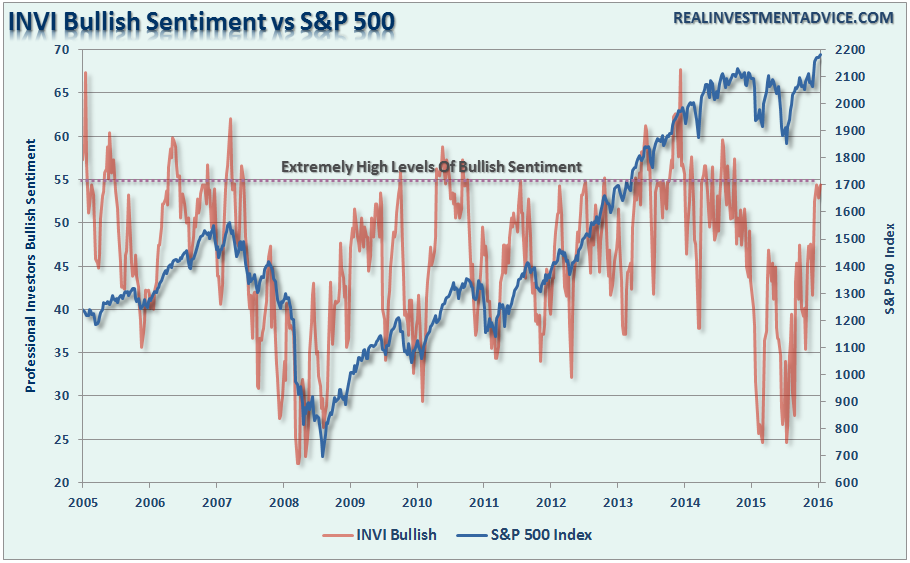
As I have noted over the last several weeks, with the markets overly extended, bullish and complacent, the risk of a correction has risen markedly.
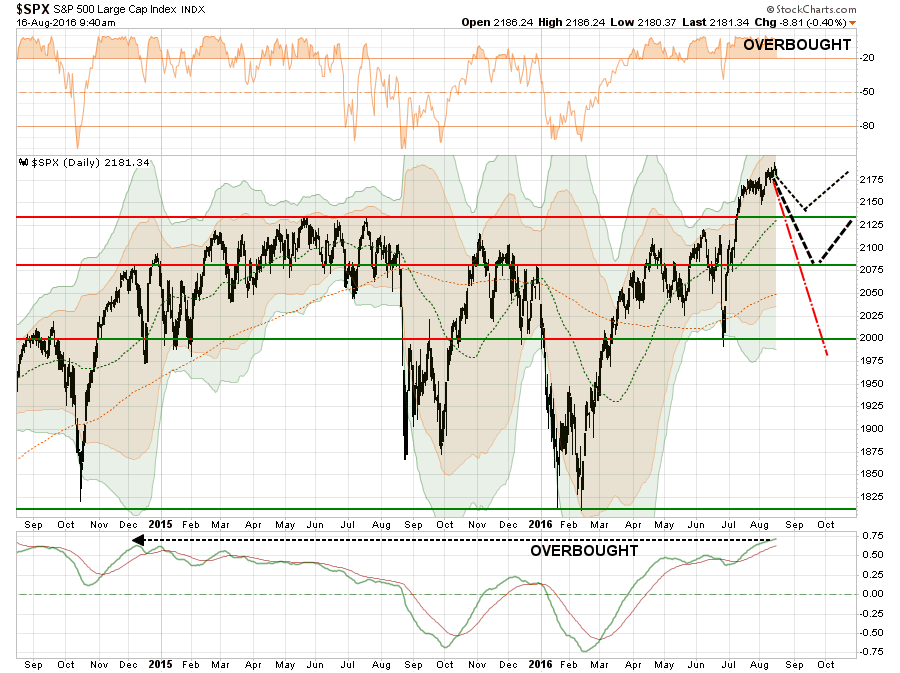
As shown in the chart above, I continue to expect a correction to relieve some of the exuberant conditions that currently exist. However, the timing, cause, and magnitude of such a correction can not be accurately predicted.
It is for this reason that I am currently:
- Carrying higher levels of cash in portfolios than normal
- Have recently increased bond exposures which will benefit from the flow of capital from “risk” back to “safety”
- Added a volatility hedge to portfolios
- Continue to “trim, prune and weed” the garden accordingly.
Importantly, I will not stay this way forever. If the markets prove me wrong, then I will unwind hedges and increase long exposures accordingly. However, given the current dynamics of the market from a historical perspective, the risk/reward is currently tilted in my favor.
For now, I patiently wait as I see no long-term benefit of excessive risk taking in the market currently. But then again, as John Maynard Keynes once quipped:
“Nothing is more suicidal than a rational investment policy in an irrational world.”
We do live in interesting times.
Lance Roberts
Lance Roberts is a Chief Portfolio Strategist/Economist for Clarity Financial. He is also the host of “The Lance Roberts Show” and Chief Editor of the “Real Investment Advice” website and author of “Real Investment Daily” blog and “Real Investment Report“. Follow Lance on Facebook, Twitter, and Linked-In
Copyright © Clarity Financial