by Don Vialoux, Timingthemarket.ca
Observations
Early signs of an intermediate peak in equity markets have appeared as positive momentum slips away.
StockTwits Released Yesterday @EquityClock
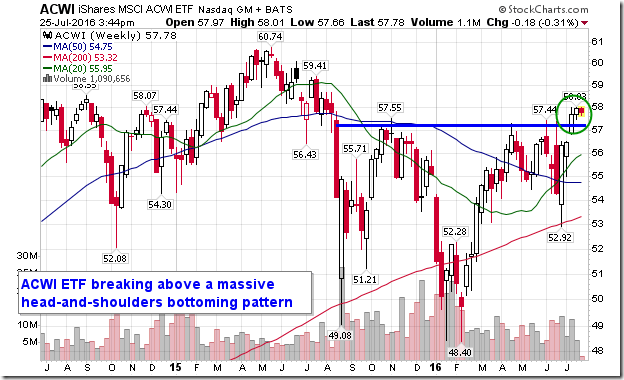
MSCI ACWI ETF showing a bullish setup as emerging equity markets improve.
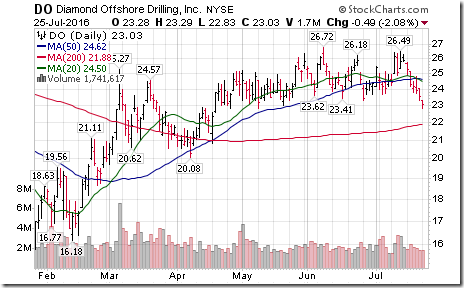
Technical action by S&P 500 stocks to 10:00: Quietly mixed. Breakouts: $CSRA, $MU. Breakdowns: $DO, $DE, $ROP.
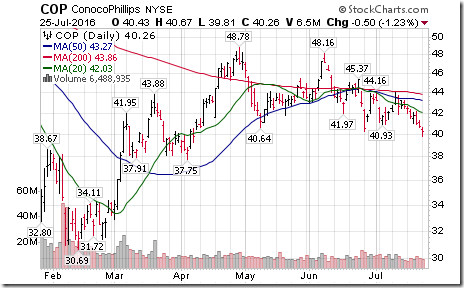
Editor’s Note: Technical action after 10:00 AM EDT remained mixed. Breakouts: Juniper Networks, Vertex Pharmaceutical. Breakdown: Cabot Oil & Gas, ConocoPhillips.
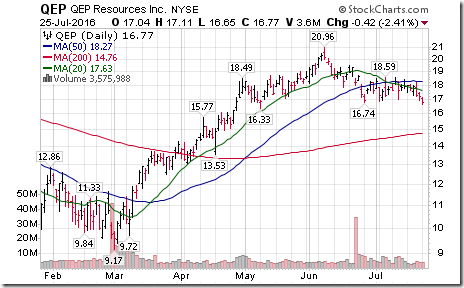
U.S. Energy stocks are notable on breakdown list: $COP, $DO, $COG, $QEP. Double tops and Head & Shoulders patterns!
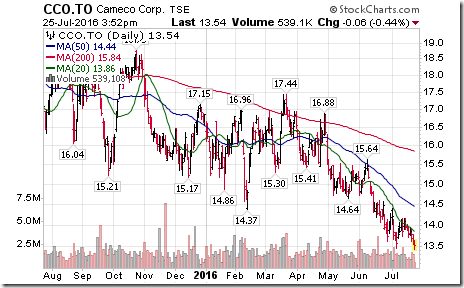
Cameco $CCO.CA broke support at $13.47 reaching a 7 year low in response to lower uranium prices.
Trader’s Corner
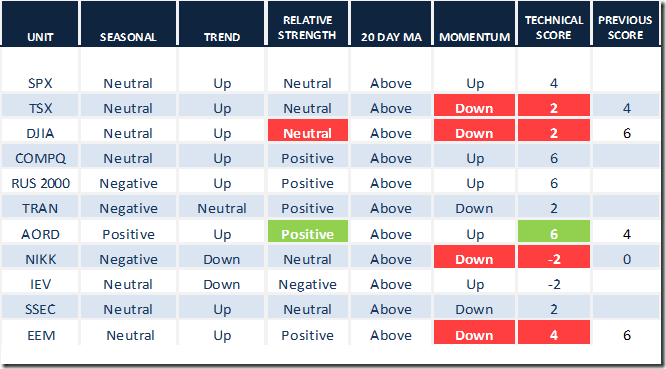
Editor’s Note: Technical score for many equity indices fell when the trend for short term momentum indicators changed to down from up.
Daily Seasonal/Technical Equity Trends for July 25th 2016
Green: Increase from previous day
Red: Decrease from previous day
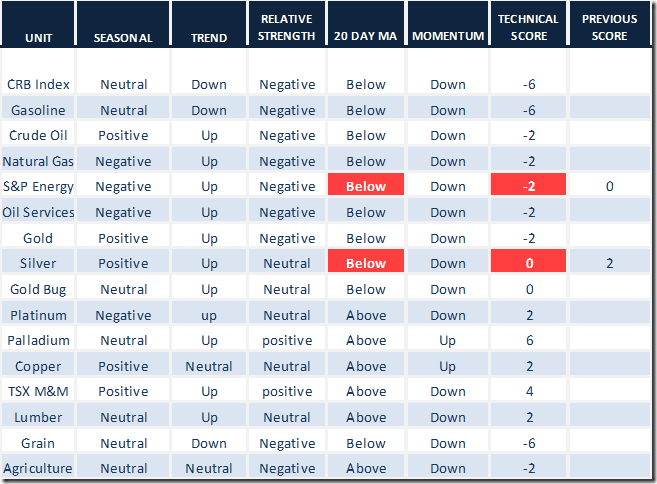
Daily Seasonal/Technical Commodities Trends for July 25th 2016
Green: Increase from previous day
Red: Decrease from previous day
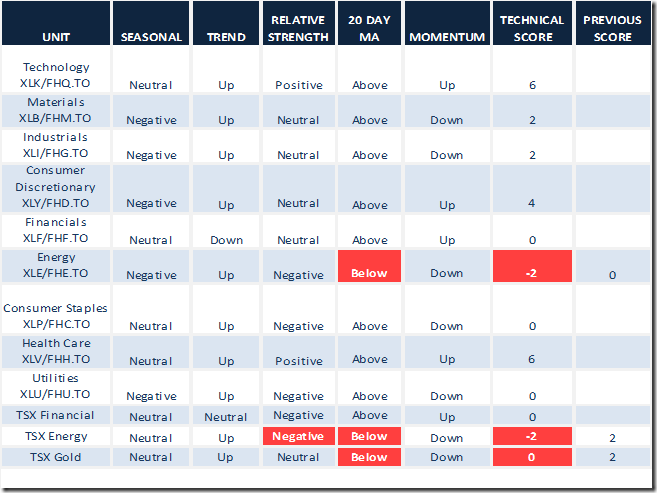
Daily Seasonal/Technical Sector Trends for March July 22nd 2016
Green: Increase from previous day
Red: Decrease from previous day
Special Free Services available through www.equityclock.com
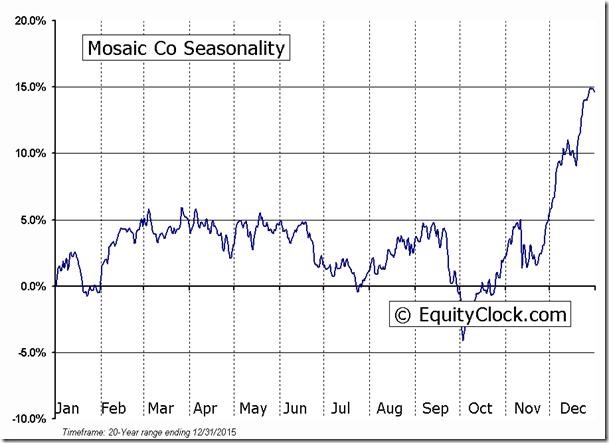
Equityclock.com is offering free access to a data base showing seasonal studies on individual stocks and sectors. The data base holds seasonality studies on over 1000 big and moderate cap securities and indices. To login, simply go to http://www.equityclock.com/charts. Following is an example:
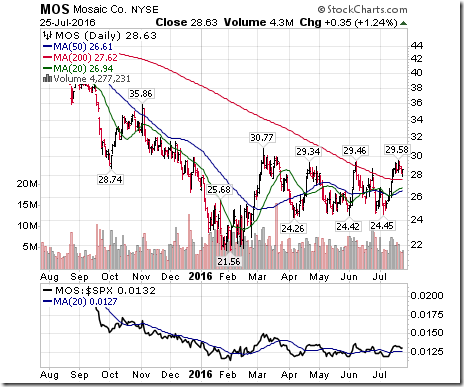
Editor’s Note: The stock has been in a base building pattern for the past five months. Strength relative to the S&P 500 Index shows early signs of outperformance as the stock enters into a period of seasonal strength (despite weakness in grain prices).
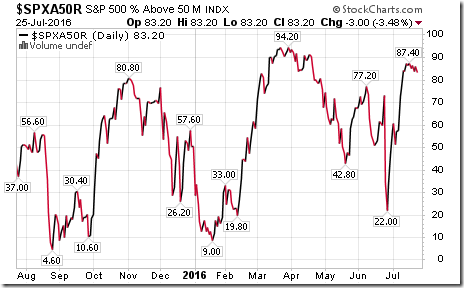
S&P 500 Momentum Barometer
The Barometer dropped 3.00 (3.48%) yesterday to 83.20. It shows increasing technical evidence of a rollover from an intermediate overbought level.
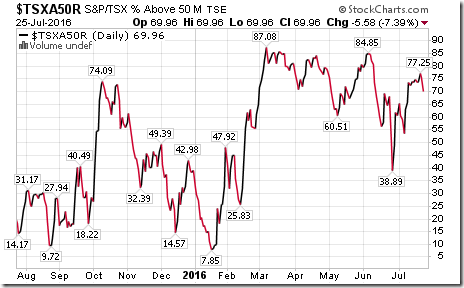
TSX Composite Momentum Barometer
The Barometer dropped 5.58 (7.39%) yesterday to 69.96. It shows increasing technical evidence of a rollover from an intermediate overbought level.
Disclaimer: Seasonality and technical ratings offered in this report by www.timingthemarket.ca and www.equityclock.com are for information only. They should not be considered as advice to purchase or to sell mentioned securities. Data offered in this report is believed to be accurate, but is not guaranteed
Copyright © DV Tech Talk, Timingthemarket.ca


