by Don Vialoux, Timingthemarket.ca
Another Milestone
Today, another milestone for EquityClock was reached on StockTwits. Number of followers increased to 25,000. Previous milestone was reached on June 27th at 24,000.
Observations
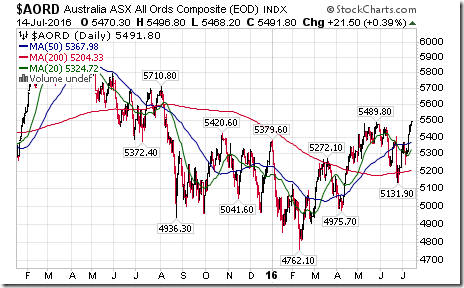
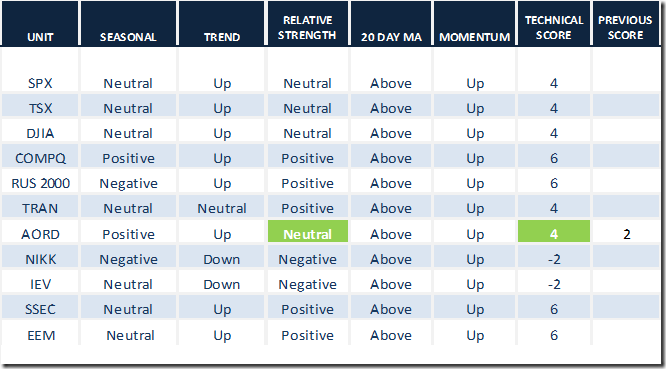
World equity indices continued to move higher yesterday. The latest county index to move above resistance to a new recent high was the Australia All Ordinaries Composite Index on a move above 5,489.80.
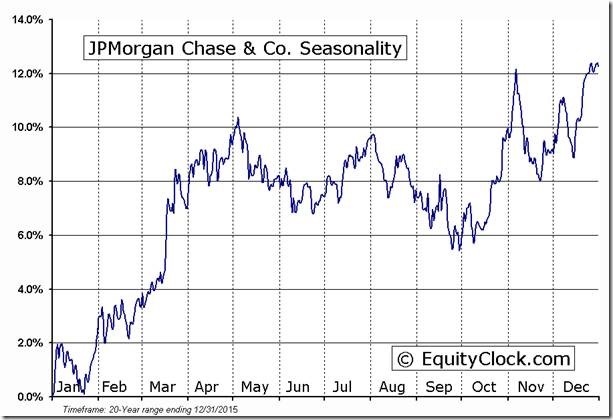
Strength in JP Morgan was the trigger for strength by S&P 500 companies yesterday when the company beat consensus second quarter earnings. A word of caution! Money center banks including JP Morgan have a history of moving higher during the second quarter report season followed by a correction period. Current positive action at this time of year has provided an opportunity to take profits on strength.
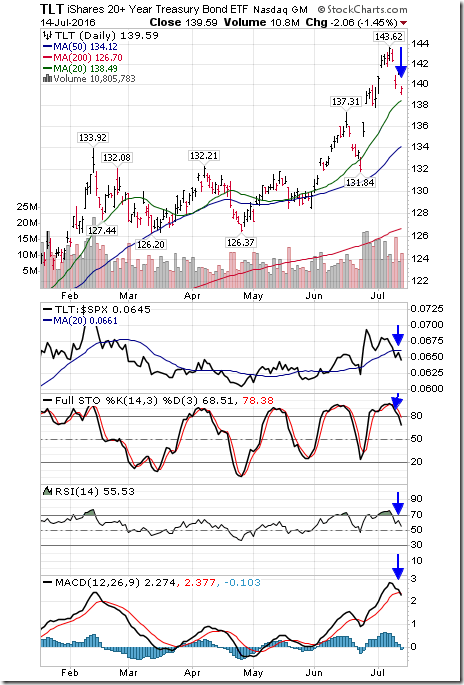
Treasury prices continue to show technical signs of rolling over. Yesterday was another brutal day for long term Treasuries. Prices responded to a higher than expected June Producer Price Index, raising concerns about rising inflation pressures. The June Consumer Price Index to be released this morning will be watched closely for more clues on inflation pressures.
StockTwits Released Yesterday @EquityClock
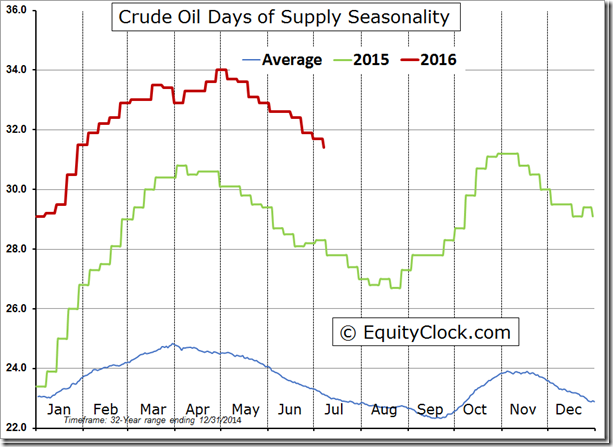
Oil inventory levels on track to decline over the next couple of months.
Technical action by S&P 500 stocks to Noon: Bullish. Breakouts: $MCD,$NWL,$AIZ,$BRKB,$PLD,$PKI,$CMI,$KSU,$ROK,$EBAY,$SYMC,$XLNX,$ECL
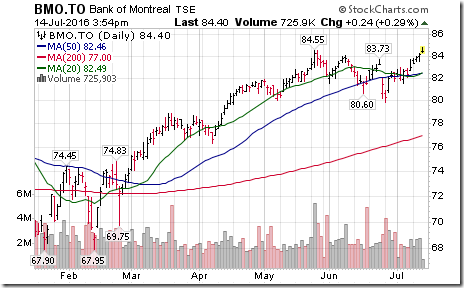
Nice breakout by BMO.CA above $84.55 to an all-time high extending an intermediate uptrend.
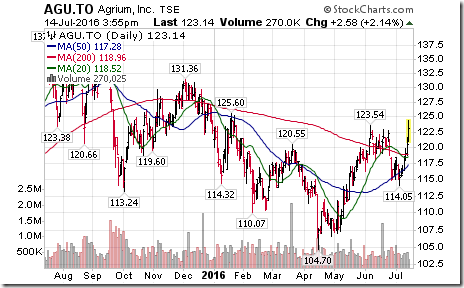
Nice breakout by AGU.CA above $123.54 Cdn. developing a new intermediate uptrend.
Editor’s note: Fertilizer stocks were strong yesterday after Belerus reached an agreement to sell potash base fertilizer to China at a lower, but fixed price.
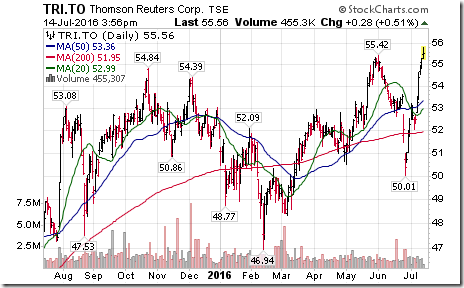
Nice breakout by $TRI.CA above $55.42 to reach an all-time high extending an intermediate uptrend.
Trader’s Corner
Daily Seasonal/Technical Equity Trends for July 14th 2016
Green: Increase from previous day
Red: Decrease from previous day
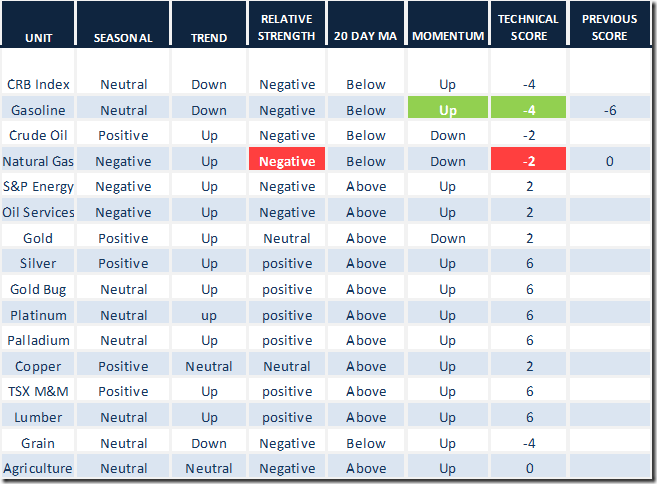
Daily Seasonal/Technical Commodities Trends for July 14th 2016
Green: Increase from previous day
Red: Decrease from previous day
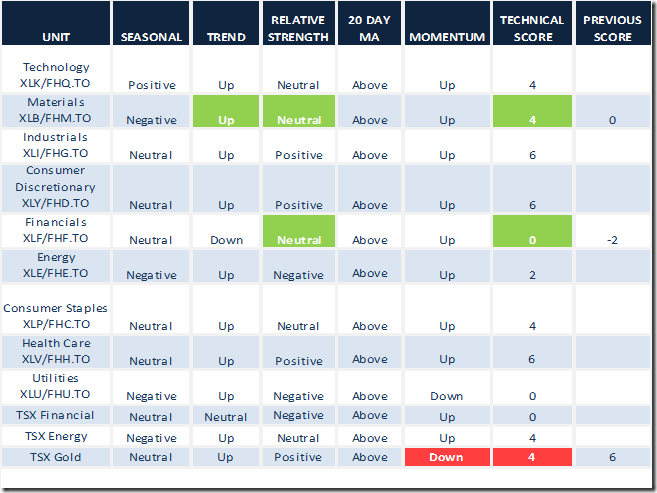
Daily Seasonal/Technical Sector Trends for March July 14th 2016
Green: Increase from previous day
Red: Decrease from previous day
Special Free Services available through www.equityclock.com
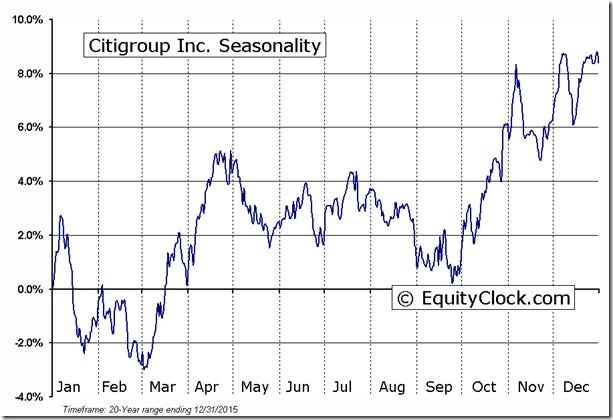
Equityclock.com is offering free access to a data base showing seasonal studies on individual stocks and sectors. The data base holds seasonality studies on over 1000 big and moderate cap securities and indices. To login, simply go to http://www.equityclock.com/charts. Following is an example:
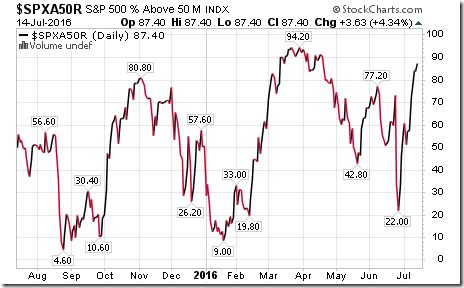
S&P Momentum Barometer
The Barometer gained another 3.63 (4.34%) to 87.40 yesterday. It remains intermediate overbought.
TSX Composite Momentum Barometer
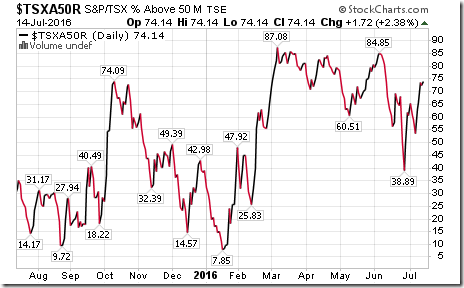
The Barometer gained another 1.72 (2.38%) to 74.14. It remains intermediate overbought.
Disclaimer: Seasonality and technical ratings offered in this report by www.timingthemarket.ca and www.equityclock.com are for information only. They should not be considered as advice to purchase or to sell mentioned securities. Data offered in this report is believed to be accurate, but is not guaranteed
Copyright © DV Tech Talk, Timingthemarket.ca


