
A Technical Outlook for U.S. Equities
For this week’s edition of the SIA Equity Leaders Weekly, we are going to revisit the US Equity Markets as the S&P 500 has moved to new all-time highs this week. All the major U.S. Equity indices are now positive for the year with the DJIA and S&P 500 up over 5% YTD and the Nasdaq Composite Index now just barely back in the green. The global markets and commodities continue to be volatile, but the Brexit shock has subsided somewhat and Japan has signaled more economic stimulus helping the global markets in the near-term. We will take a closer look at the U.S. Equity markets through analysis on the S&P 500 Index and Nasdaq Composite Index.
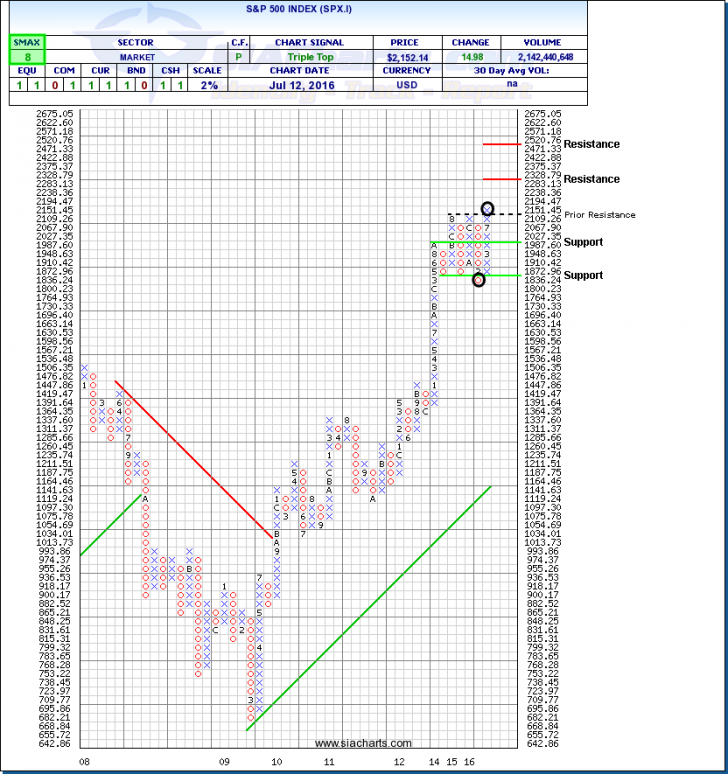
S&P 500 Index (SPX.I)
A chart that we have been paying close attention to in the SIA Equity Leaders Weekly over the past while, the S&P 500 Index (SPX.I) has finally broken through to new all-time highs this week. On a 2% point and figure chart, this has now signaled a triple top chart pattern having moved up above prior resistance. Support to the downside is now found at 1987.6 and at 1836 should this strength reverse. Resistance above can now be thought of as some potential price targets if this strength continues as the 2300 and 2500 levels might provide some psychological resistance.
Although this seems to be a very bullish move and pattern set up, we wanted to highlight what happened in February of this year as at that time the S&P 500 Index moved into a triple bottom chart pattern and then quickly reversed back into a column of X’s with the breakthrough to the downside never materializing. Could a similar reversal take place now in a reciprocal chart pattern? The markets hate uncertainty and the US has some important events still to be decided in an election year, falling earnings, USD currency fluctuations, and the ongoing threat of the Fed raising interest rates will most likely continue to weigh on the market direction before longer term trends are realized. But from a technical charting standpoint, this break to new all-time highs for the S&P 500 may be a cause for celebration to some as U.S. Equity continues to be a highly ranked asset class and a significant allocation to many portfolios and strategies.
Click on Image to Enlarge
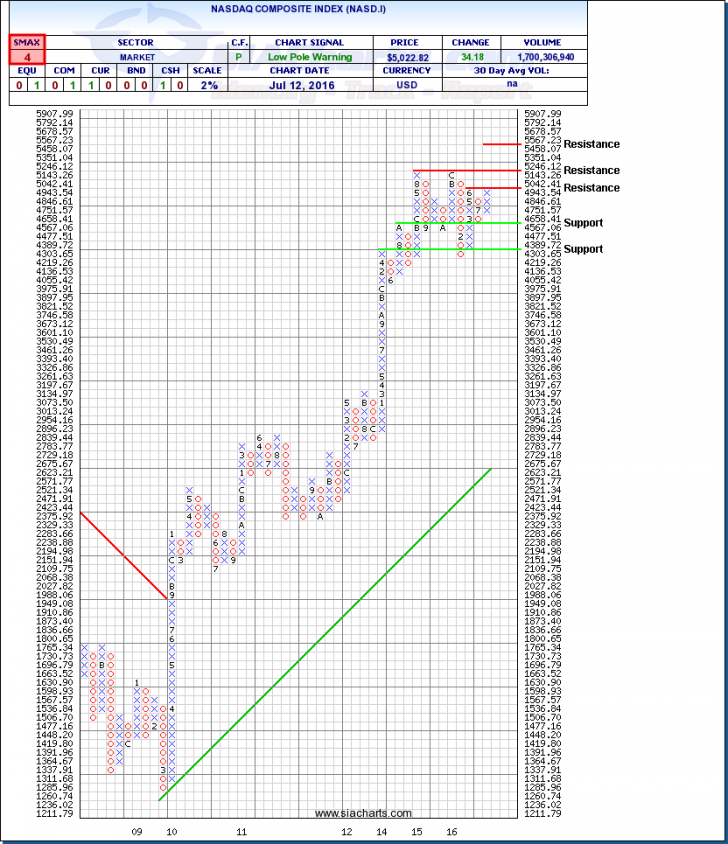
Nasdaq Composite Index (NASD.I)
After looking at the chart of the S&P 500 Index, let’s now draw our attention to the chart of the Nasdaq Composite Index (NASD.I). We haven’t looked at this individual chart in a while, but did just highlight it in a comparison with the S&P 500 a month ago that showed the change in leadership away from the NASD.I to the SPX.I. Unlike the S&P 500 that has moved to new highs, the NASD.I has struggled to break through the 5000 psychological resistance level which you can see on the chart at 5042 which it had reversed off of in June and stalled at in the summer of 2015 previously. To move to new all-time highs, the level to keep an eye on is around 5246. Support can be found to the downside at 4567 and at 4300 if needed.
If you are looking for more confirmation of a continued rally in U.S. Equity, you might want to see a breakthrough on the technology-driven Nasdaq index as well. Or by continuing to monitor the key U.S. Equity indices and comparisons between them can give you some basic understanding of where the strength is coming from based on the focus or weighting of the index. The Nasdaq has surpassed the 5,000 level for the first time this year and will be an important chart to keep an eye on moving forward as well to see if it can also move to new all-time highs like the S&P 500 did.
For a more in-depth analysis on the relative strength of the equity markets, bonds, commodities, currencies, etc. or for more information on SIACharts.com, you can contact our customer support at 1-877-668-1332 or at siateam@siacharts.com.
Click on Image to Enlarge
SIACharts.com specifically represents that it does not give investment advice or advocate the purchase or sale of any security or investment. None of the information contained in this website or document constitutes an offer to sell or the solicitation of an offer to buy any security or other investment or an offer to provide investment services of any kind. Neither SIACharts.com (FundCharts Inc.) nor its third party content providers shall be liable for any errors, inaccuracies or delays in content, or for any actions taken in reliance thereon.
Copyright © SIACharts.com