by Don Vialoux, Timingthemarket.ca
Observations
Another brutal day on world equity markets thanks to continuing Brexit concerns! A wide variety of equity markets and sectors broke key support levels yesterday. Downtrends for an increasing number of equity markets/sectors/individual equities (other than interest sensitive and precious metal sectors) were recorded. Momentum indicators for North American equity markets already are oversold, but have yet to show signs of bottoming. Anticipation of mixed-to-difficult second quarter earnings reports starting in the second week in July will not help investor sentiment. See consensus estimates for TSX 60 companies below. Best for equity investors and traders with cash to “sit in the weeds” at least until technical signs of a bottom have been recorded.
StockTwits Released Yesterday
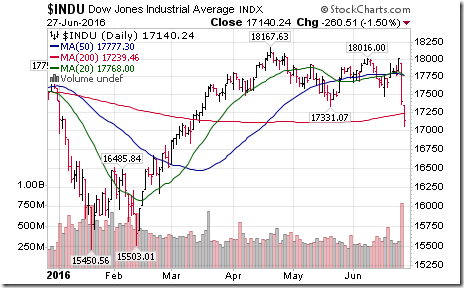
Selling pressures mounted when Dow Jones Industrial Average broke 17,331.07 completing a double top pattern.
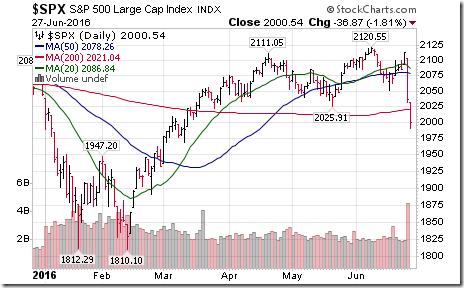
Selling pressures mounted when S&P 500 broke support at 2,025.91 completing a double top pattern.
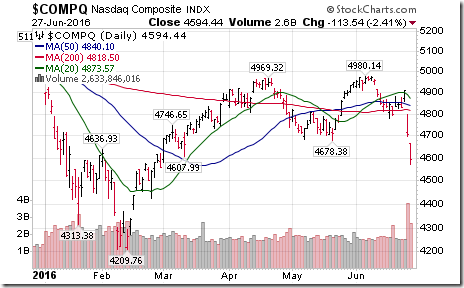
Selling pressures mounted when the NASDAQ broke support at 4,678.38 completing a double top pattern.
Technical action by S&P 500 stocks to 10:15: Brearish. 51 stocks broke support. Notable: 14 financials, 8 consumer discretionary
Editor’s Note: After 10:15 AM EDT, another 44 S&P 500 stocks broke support and 3 stocks broke resistance
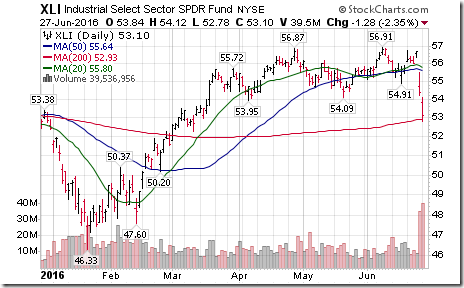
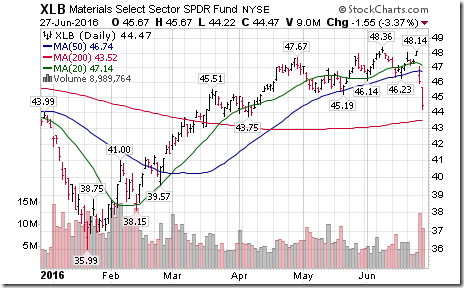
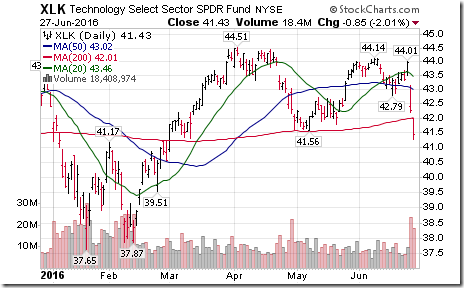
Double top patterns completed by $XLI, $XLB, $XLK following breaks through support.
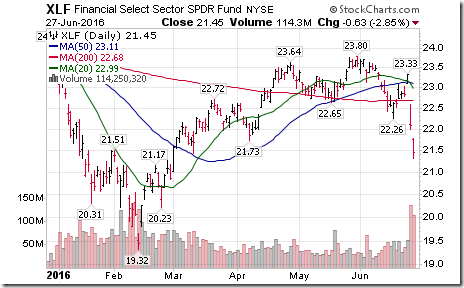
Editor’s Note: Weakest sector SPDR was XLF
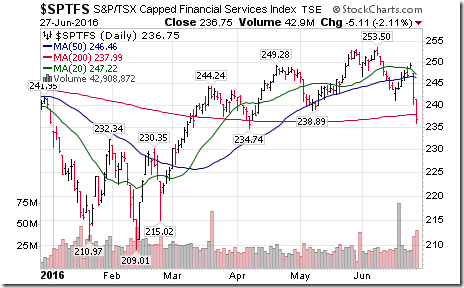
Cdn. Financials notably under pressure. TSX Financial Index broke support at 238.89 $XFN.CA
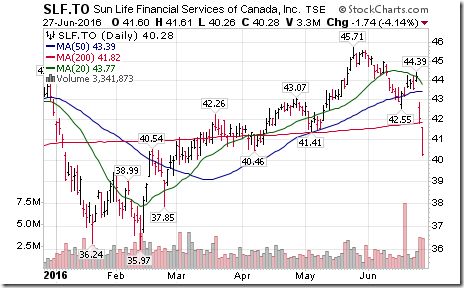
Canadian financials breaking support included $RY.CA, $BMO.CA, $MFC.CA, $SLF.CA
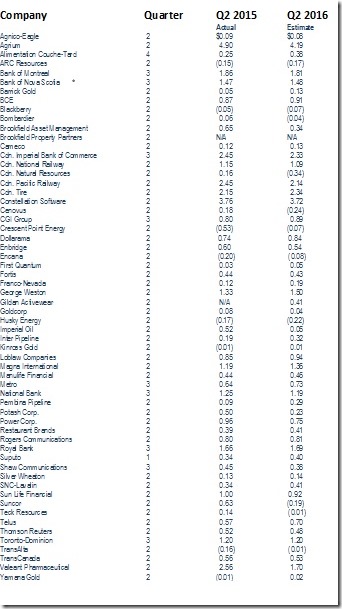
Consensus Calendar Second Quarter Earnings per Share for S&P/TSX 60 companies
Earnings per share by Canada’s largest listed companies show a mixed picture: 29 companies are expected to report higher earnings per share on a year-over-year basis, 28 companies are expected to report lower earnings, one company is expected to report no change and two companies do not provide comparable data. Average (median) company is expected to record a gain of 0.68%. Companies expected to report the highest percent gain include Dollarama, Franco-Nevada, Inter Pipeline and SNC Lavalin. Companies expected to report the highest percent decline include Husky Energy, Imperial Oil, Suncor, Potash Corp and Valeant Pharmaceutical. Following is the data:
*Median
Source: www.globeinvestor.com
Trader’s Corner
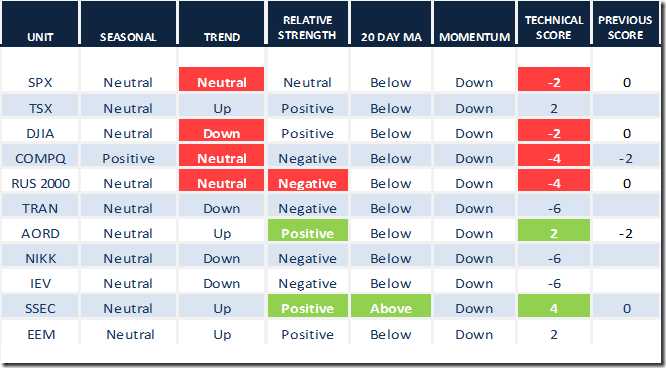
Daily Seasonal/Technical Equity Trends for June 27th 2016
Green: Increase from previous day
Red: Decrease from previous day
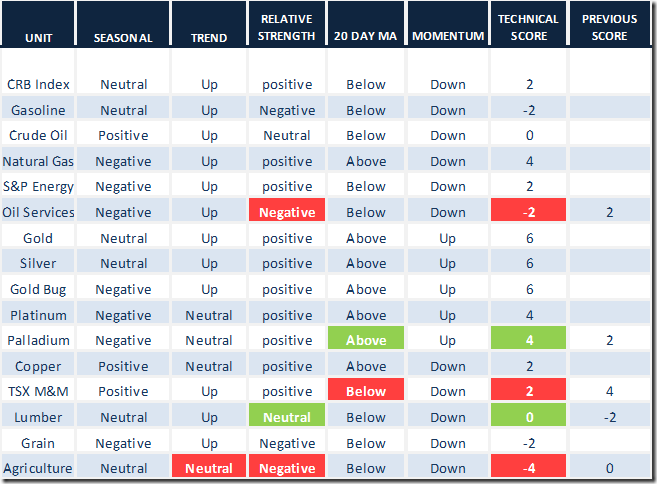
Daily Seasonal/Technical Commodities Trends for June 27th 2016
Green: Increase from previous day
Red: Decrease from previous day
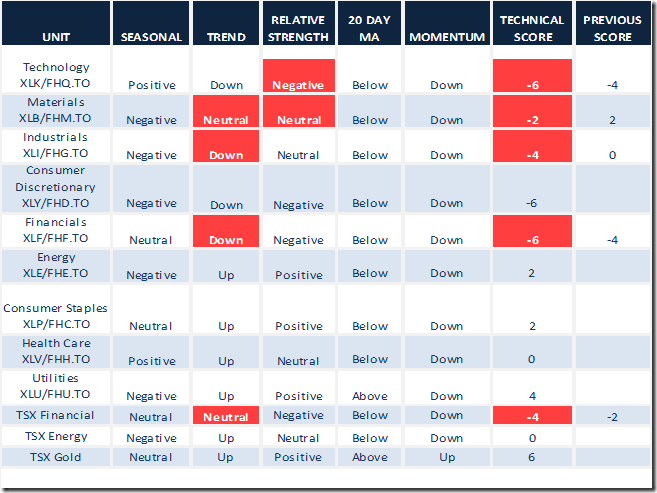
Daily Seasonal/Technical Sector Trends for March June 27th 2016
Green: Increase from previous day
Red: Decrease from previous day
Special Free Services available through www.equityclock.com
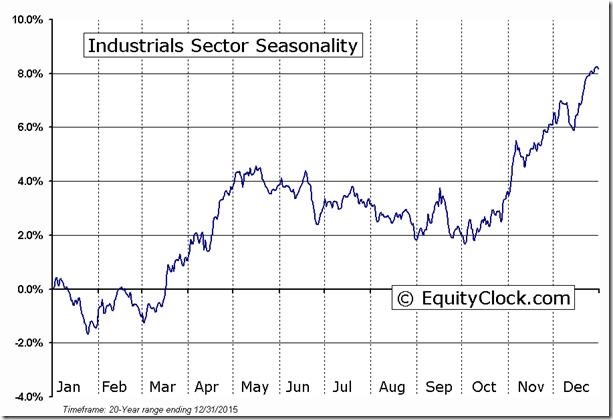
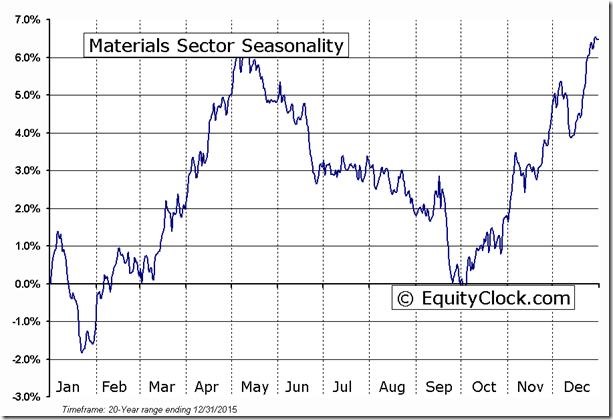
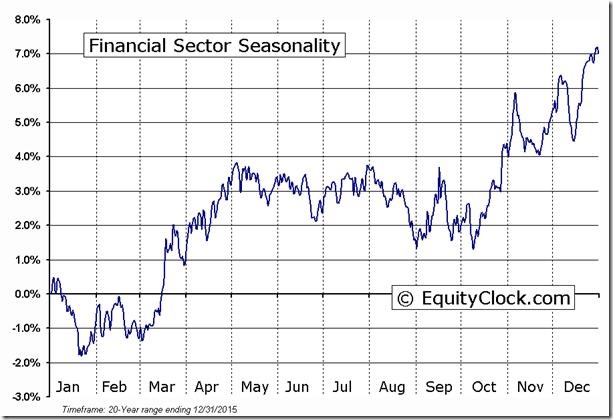
Equityclock.com is offering free access to a data base showing seasonal studies on individual stocks and sectors. The data base holds seasonality studies on over 1000 big and moderate cap securities and indices. To login, simply go to http://www.equityclock.com/charts. Following are examples:
Interesting Charts
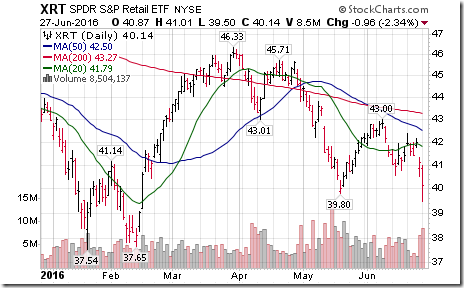
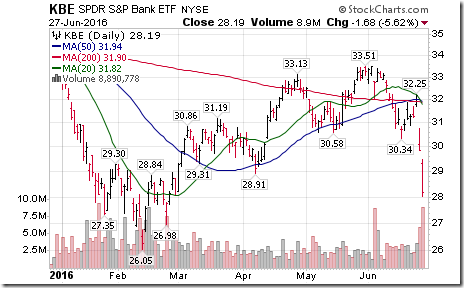
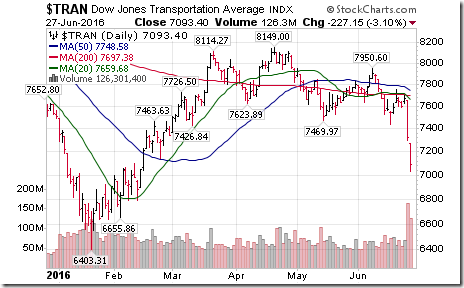
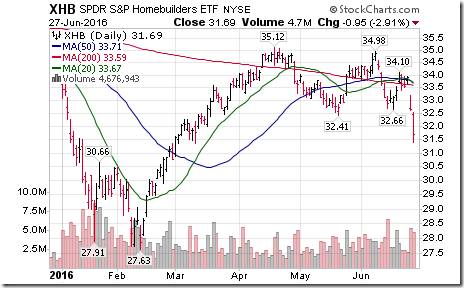
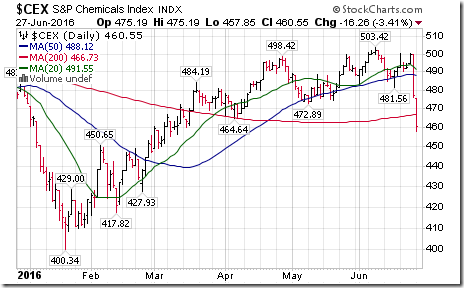
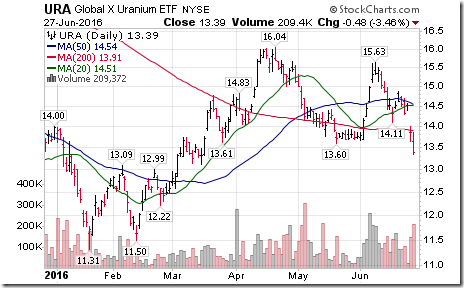
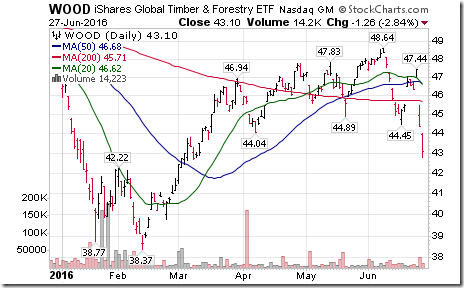
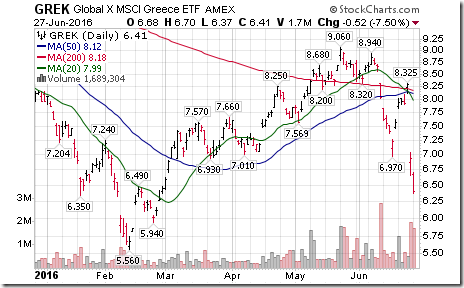
Lots of brutal second tier sector indices /sectors/ETFs yesterday that recorded significant breakdowns and/or tracked large drawdowns:
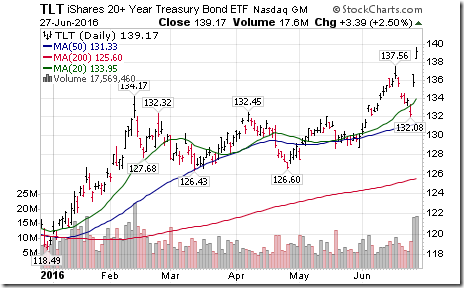
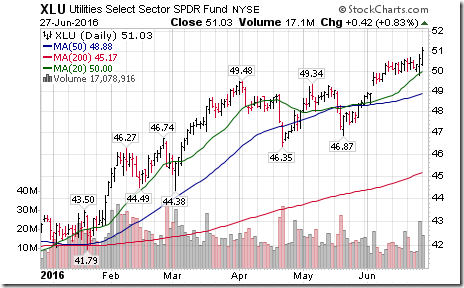
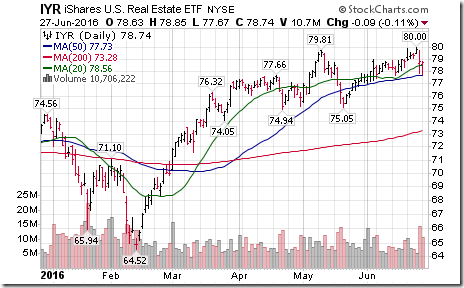
Interest sensitive sectors continue to go in the other direction:
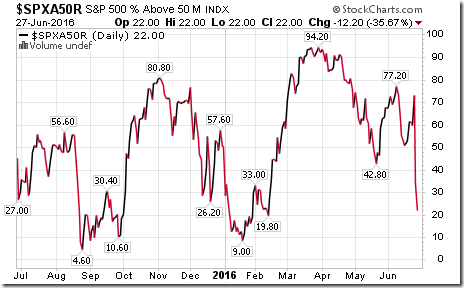
S&P 500 Momentum Barometer
S&P 500 Momentum Barometer plunged 12.20 to 22.00 yesterday. The Barometer remains in a short term downtrend, but is already intermediate oversold. However, signs of a bottom have yet to appear.
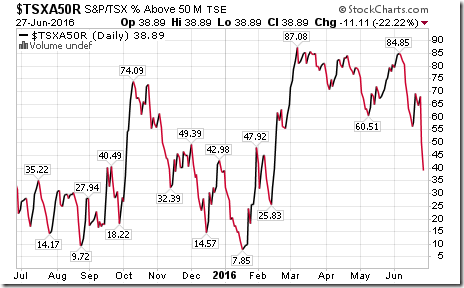
TSX Momentum Barometer
The TSX momentum barometer plunged 11.11 to 38.89. The Barometer remains in a short term downtrend, but already is intermediate oversold. However, signs of a bottom have yet to appear.
Disclaimer: Seasonality and technical ratings offered in this report by www.timingthemarket.ca and www.equityclock.com are for information only. They should not be considered as advice to purchase or to sell mentioned securities. Data offered in this report is believed to be accurate, but is not guaranteed
Copyright © DV Tech Talk, Timingthemarket.ca


