
Canadian Equities Continue Trending Higher, Natural Gas Too
SIA Equity Leaders Weekly – Jun 09, 2016
For this week’s Equity Leaders Weekly, we are going to take a look at the broad Canadian Equity Market, through the S&P/TSX Composite Index (TSX.I), which has continued its upwards trend into June from its lows in January. We will also take a look at the commodity natural gas through the continuous contract (NG.F), as it looks to continue on with its recent strength.
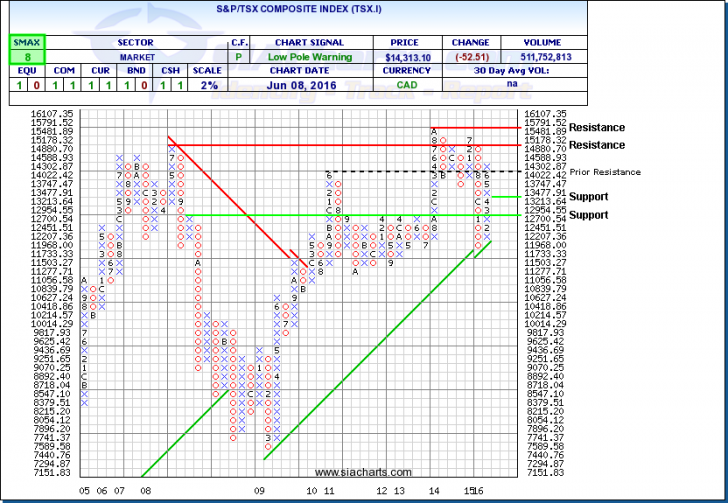
S&P/TSX Composite (TSX.I)
The last time we looked at the S&P/TSX Composite Index it had rebounded off of 2016 lows and was sitting around the mid $13000’s. Since then we have seen the TSX continue its move upwards, which entered into bull market territory last Friday with a close above $14,226 - up 20.1% off January 2016 lows. On Wednesday, the index touched highs at $14,450 which we have not seen since August 2015, but pulled back to close at $14,313.10. From the chart of TSX.I, we can see that should this uptrend continue, we may see resistance around $15,000 and above that at all time highs at $15,791. Support for TSX.I is at $13,213 and $12,700. TSX.I is showing near term strength against the asset classes with an SMAX score of 8 out of 10.
The S&P/TSX Composite Index rally this year has been led by energy and miners as major commodities have climbed off lows seen earlier this year. Last Friday, we saw some support for commodity bulls that came after the US Department of Labor released a report indicating that the American economy added only 38,000 new jobs in May. This number was well below estimates and also the lowest monthly number in 5 years. With so much ambiguity coming from the US Federal Reserve in terms of their plans with interest rates the markets responded to this negative news and put downward pressure on the US dollar. The market probability of a Fed rate increase before December of this year has fallen significantly which is positive in the short term for commodities, associated equities, and commodity heavy exchanges like the TSX.I. Important non-commodity names in the Canadian market like DOL.TO also posted solid gains as a result of strong Q1 financial results.
Click on Image to Enlarge
Natural Gas Continuous Contract (NG.F)
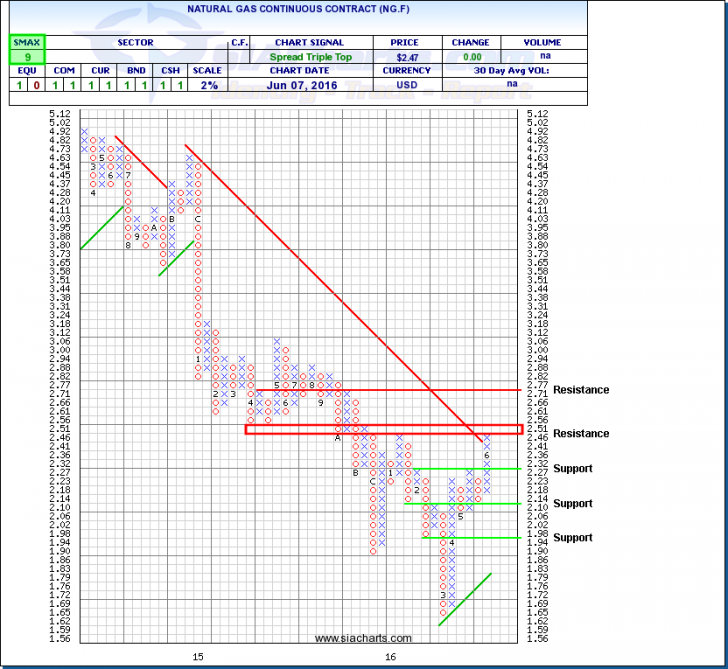
The last time we looked at Natural Gas in the ELW was on April 14, 2016 where NG.F was sitting around $2.00 and had made a strong positive move off of the 20 year lows we saw in March. NG.F has continued its strength up another 20% to prices we have not seen since October of last year, closing at $2.4650 Wednesday afternoon. In the short term, weather models are pointing to above-normal temperatures for the next two weeks which will give the natural gas bulls some steam. Historically, demand for natural gas goes up in the summer months as warmer temperatures increase the need for gas-fired electricity to power air conditioning units.
Last week’s Natural Gas Storage report from the Energy Information Administration stood at 2.907 tcf which is ~25% higher than this time last year. The street is forecasting a 78bcf build in stockpiles from this weeks storage report from the EIA which will be released tomorrow. Some analysts believe that we may test physical storage limits at 4.3tcf this summer which could put some downward pressure on natural gas prices, should we continue to build on current storage levels.
In looking at the chart, we can see that NG.F is approaching strong resistance around the $2.50 area, however, a close above this level this could see a move to the next resistance at $2.77. Support for NG.F stands at $2.27, $2.10, and at $1.94. NG.F is showing near term strength against the broad asset classes with an SMAX score of 9 out of 10.
For a more in-depth analysis on the relative strength of the equity markets, bonds, commodities, currencies, etc. or for more information on SIACharts.com, you can contact our customer support at 1-877-668-1332 or at siateam@siacharts.com.
Click on Image to Enlarge
SIACharts.com specifically represents that it does not give investment advice or advocate the purchase or sale of any security or investment. None of the information contained in this website or document constitutes an offer to sell or the solicitation of an offer to buy any security or other investment or an offer to provide investment services of any kind. Neither SIACharts.com (FundCharts Inc.) nor its third party content providers shall be liable for any errors, inaccuracies or delays in content, or for any actions taken in reliance thereon.