


Selling in May is Harder in Practice
by Carl Swenlin and Erin Heim, Stockcharts.com
Research published by Yale Hirsch in the Stock Trader’s Almanac shows that the market year is broken into two six-month seasonality periods. The period from May 1 through October 31 is seasonally unfavorable, and the market most often finishes lower than it was at the beginning of the period. The period from November 1 through April 30 is seasonally favorable, and the market most often finishes the period higher. (See Sy Harding’s book Riding the Bear for details on this subject.) While the statistical average results for these two periods are quite compelling, trying to ride the market in real-time in hopes of capturing these results is not always as easy as it sounds.
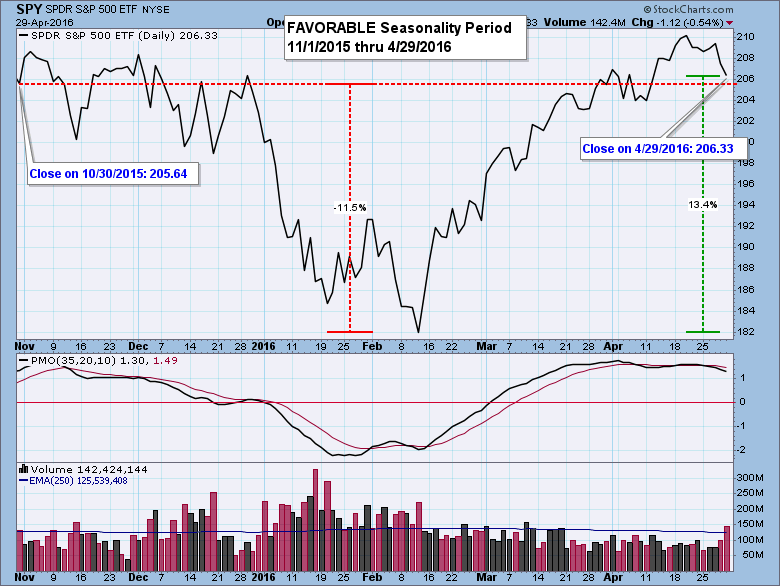
The chart above shows the favorable six-month period just ended, and we can see that SPY closed less than one point above its starting point at the end of October. Technically, it fulfilled its positive expectations, but as a practical matter the sharp decline into the February low would have made holding a long position based solely on seasonality a painful experience.
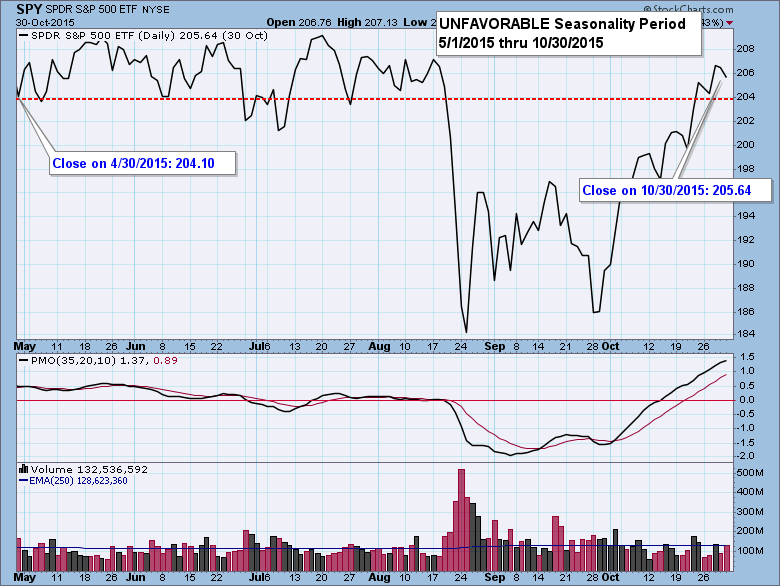
Now let's look at the last six-month unfavorable period from May 1, 2015 through October 30, 2015 on the chart below. It is amazingly similar to the favorable period just ended. Negative expectations were fulfilled with the turbulence in August and September, but price recovered so that SPY closed slightly above the May starting point.
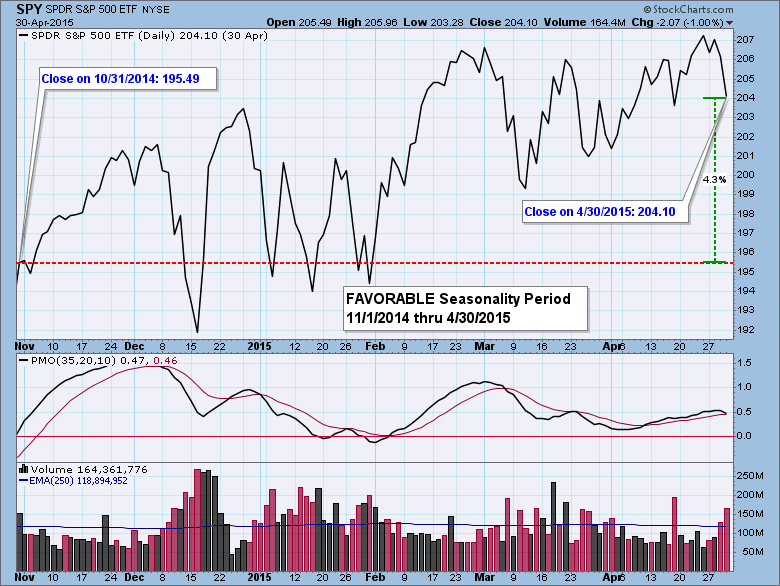
Now let's go back one more period to the favorable period from November 2014 through April 2015. Finally, we have a period that meets bullish expectations without a great deal of volatility.
While the title of this article announces the end of a favorable period, the real news is that a new unfavorable six-month period will begin on Monday, and we are reminded of the old saying, "Sell in May, and go away." Unfortunately, we can see from the first two charts that seasonality rules are not always reliable. Rather, it is important to remember that seasonal tendencies will be working to pull prices down. Whether or not negative seasonality will prevail over more positive forces that may materialize we can't know, but we should be aware of historical tendencies that will be influencing the market for the next six months.
Technical analysis is a windsock, not a crystal ball.


