SIA Weekly: The USDCAD Relationship, and Natural Gas Prices
For this week’s editions of the Equity Leaders Weekly we are going to take a look at the USDCAD relationship as well as give an update on a key commodity, natural gas.
United States Dollar/Canadian Dollar (USDCAD)
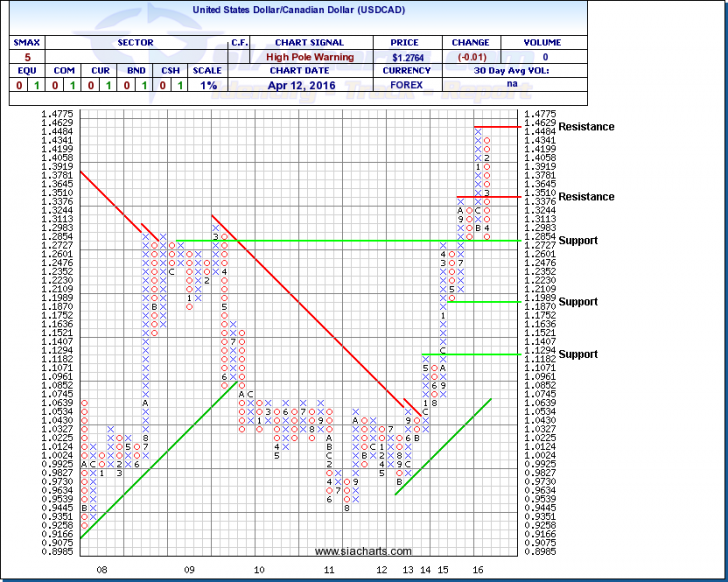
The U.S. Dollar has continued its pullback of late retracing ~10% against the Canadian Dollar from its mid-January peak of 1.4484 to close at 1.2817 on Wednesday afternoon. With the Fed continuing to speak with dovish tones and to leave interest rates where they are has put a lot of short term downward pressure on the USD relative to other currencies as policy makers feel that the economy is not prepared for an interest rate increase yet. By choosing to keep interest rates lower, in the short term this is positive for commodity prices (as they are priced in $US) as well as commodity producing currencies. A continued slide in the USD could also be a catalyst for Fed action to prevent foreign money from flowing out of the U.S. and into other economies where currency depreciation is less a concern.
Looking at the USDCAD chart we can see it is at support right now at $1.2727 which it bounced off in October 2015. Further support can be found at $1.1989 and again at $1.1182. Should USDCAD reverse trend, we can find resistance at $1.3510 and at $1.4629.
Click on Image to Enlarge
Natural Gas (NG.F)
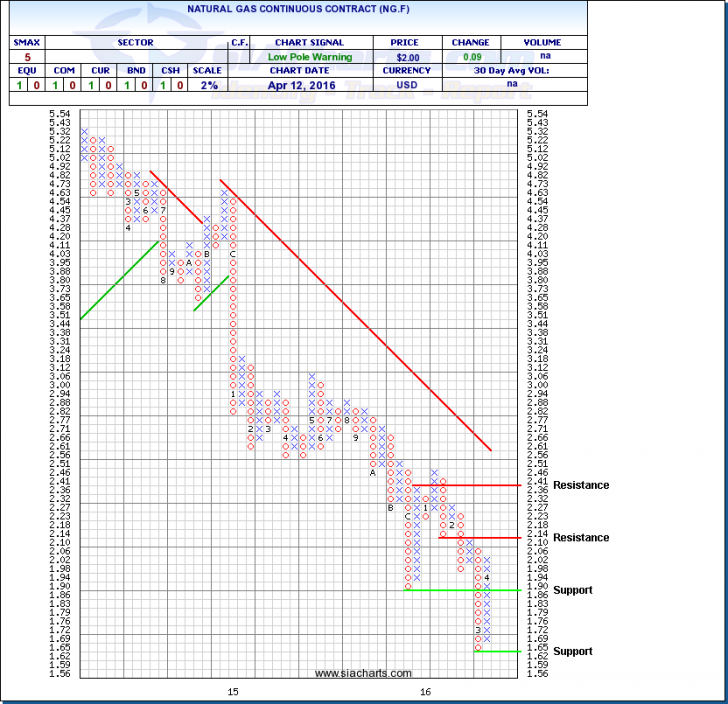
The last time we looked at Natural Gas in the Equity Leaders Weekly was on February 24th, 2016 where NG.F was continuing on its downtrend to start 2016 and was sitting at $1.83. The front month natural gas contract continued to fall to 20 year lows at ~$1.62 and has rallied over 20% since and settled at $2.0350 on Wednesday April 13. Despite the recent rally natural gas still sits down roughly 12% YTD with most price action occurring in the near term months and less movement further down the futures curve.
In regards to NG.F fundamentals, storage is still a concern with the EIA reporting another larger than predicted build in inventories last week (12bcf vs 8 bcf estimated). Stockpiles for the end of the November-March withdrawal season sit at an all time high of 2.480 trillion cubic feet as a result of warmer weather and a mild winter in North America.
In looking at the NG.F chart we can see resistance at $2.14 and again at $2.41. Support can be found at $1.86 and $1.62. With and SMAX score of 5 out of 10, NG.F is showing some near-term strength against the asset classes.
For a more in-depth analysis on the relative strength of the equity markets, bonds, commodities, currencies, etc. or for more information on SIACharts.com, you can contact our customer support at 1-877-668-1332 orsiateam@siacharts.com.
Click on Image to Enlarge
SIACharts.com specifically represents that it does not give investment advice or advocate the purchase or sale of any security or investment. None of the information contained in this website or document constitutes an offer to sell or the solicitation of an offer to buy any security or other investment or an offer to provide investment services of any kind. Neither SIACharts.com (FundCharts Inc.) nor its third party content providers shall be liable for any errors, inaccuracies or delays in content, or for any actions taken in reliance thereon.
Copyright © SIACharts.com