


Why You Should Hope for a Bear Market
by Justin Sibears, Newfound Research
In our 2016 Market Outlook (available on our website), we discuss expected real returns for U.S. equities over the next decade. The picture isn't pretty. A bear market may be just what the doctor ordered.
| U.S. Large-Cap Expected Real Return | Forecast Horizon | |
|---|---|---|
| Jack Bogle | 2.0% | 10 Years |
| Research Affiliates | 1.2% | 10 Years |
| GMO | -2.7% | 7 Years |
Sources: Bogle, Research Affiliates, GMO
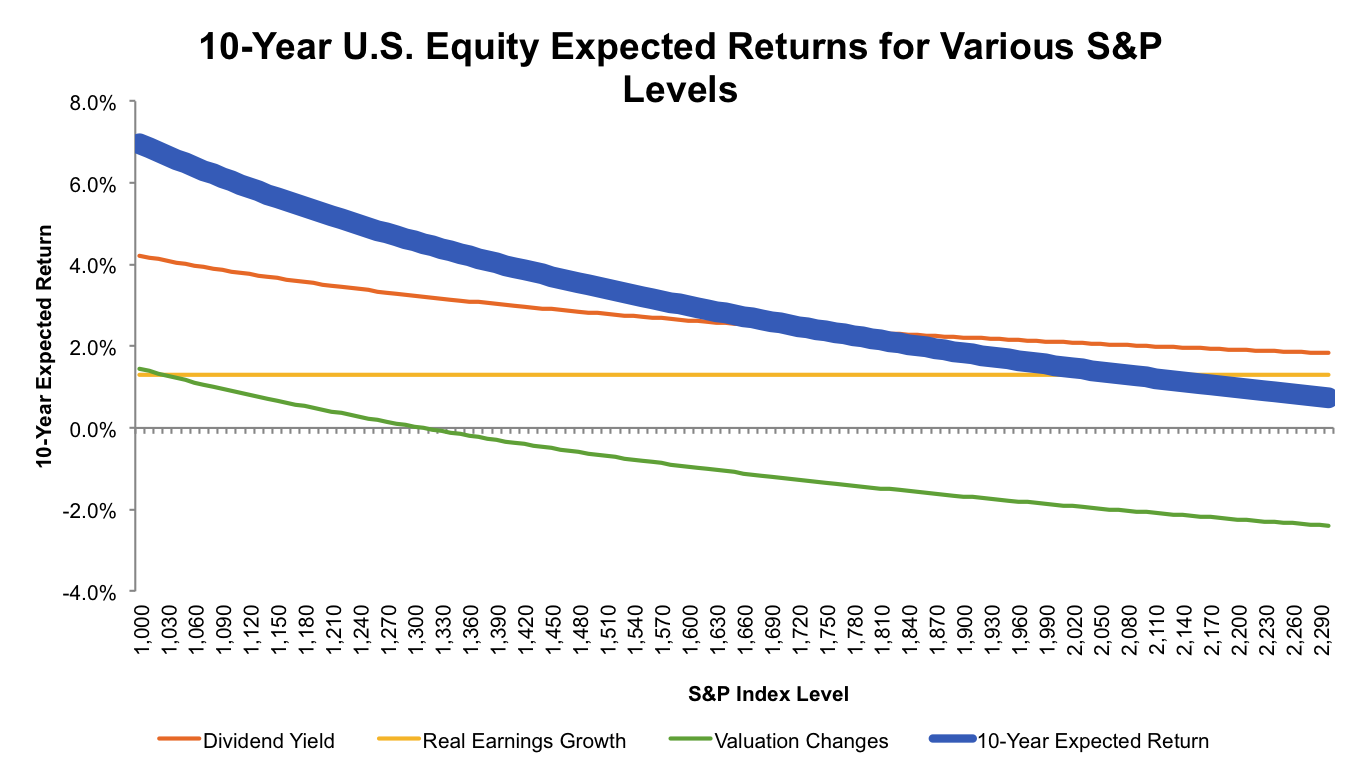
After-inflation equity returns can be decomposed into three components:
- Dividend Yield
- Real Earnings Growth
- Multiple Expansion / Contraction (i.e. valuation changes)
Assuming that dividends and earnings are fixed (which obviously isn't accurate, but keeps the analysis simple), market fluctuations will impact the first - dividend yield - and third - valuation changes - sources of return.
When the equity market declines, dividend yields will increase and valuations will decline. Both changes will increase expected returns going forward.
When the equity market rises, the opposite occurs. Dividend yields fall and stocks become more expensive, depressing future returns.
Below, we plot in blue how the 10-year expected return forecast for the S&P 500 would change if the S&P 500 instantaneously repriced to a given level.
Source: Shiller Online Data, Research Affiliates, Newfound Research, Yahoo! Finance. These forecasts are forward-looking statements based on our reasonable beliefs and are not a guarantee of future performance. This content is not investment or tax advice or an offer, sale or any solicitation of any offer to buy any security, derivative, or other financial instrument.
At the current S&P 500 level of around 1,915, our simple model spits out a 10-year expected real return of 1.8% (+2.2% from dividends, +1.3% from real earnings growth, and -1.7% from multiple contraction as valuations fall back to more historically consistent levels).
I think the interesting thing about the graph above is that we can use it to see how far the market would have to fall for expected returns to rise to a given level.
Let's say we want stocks to do 4% per year after inflation, which is probably still on the low end of what many assume in financial planning.
To get there with current fundamentals, we would need the S&P 500 to drop to around 1,390, a 28% drop from yesterday's close and a 35% drawdown from all-time highs. This would move us clearly into bear market territory. In terms of components, this breaks down to 3.0% from dividends, 1.3% from real earnings growth, and -0.3% from multiple contraction.
Our takeaway, a 10% dip from all-time highs just isn't going to move the needle when it comes to getting future equity returns out of the doldrums.
Copyright © Newfound Research