


God, Buffett, and the Three Oenophiles
by Justin Sibears, Newfound Research
Our friends at Alpha Architect just wrote a great piece titled “Even God Would Get Fired as an Active Investor.” In the study, they show that while an omnipotent investor with perfect foresight would have delivered great returns over the long run, he would be fired many times along the way due to short-term underperformance. Quoting from the post:
“Our bottom line result is that perfect foresight has great returns, but gut-wrenching drawdowns. In other words, an active manager who was clairvoyant, and knew ahead of time exactly which stocks were going to be long-term winners and long-term losers, would likely get fired many times over if they were managing other people’s money.
Question: If God is omnipotent, could he create a hedge fund that was so good that he could never get fired? No. It turns out even God would most likely get fired as an active investor.”
We encourage you to visit Alpha Architect’s website as this is just one example of the great research they consistently publish.
In this post, we will perform similar analysis, but for stock/bond asset allocation instead of active stock picking. We use this example to expand on the Alpha Architect analysis.
That being said, we want to stress that the key takeaways - at least in our mind - of the Alpha Architect piece remain unchanged. If you want to outperform standard benchmarks over the long-run, you necessarily must put on positions that are different than the benchmark holdings. Different holdings means tracking error. And tracking error inevitably means that short-term underperformance will happen eventually.
The Quest for the Holy Grail
In our opinion, the Alpha Architect piece should be required reading for investors, advisors, and clients alike. It highlights what Ben Carlson called the danger of “short-term thinking with long-term capital.”
While there are number of approaches to investing that have worked in the long run, performance chasing is not one of them.
Ironically, the constant quest for the holy grail of investing may be one of the bigger hurdles to financial success. There is no holy grail in investing. I repeat, there is no holy grail of investing.
Asset classes and strategies will always ebb and flow through periods of out and underperformance. No strategy will beat the market year in and year out. It just won’t happen. Even Alpha Architect’s omnipotent investor isn’t perfect in the short-run.
Open Your Eyes, Look Within
The never ending quest for the holy grail of investing reminds us of today's health and fitness industry. There is an obsession with finding the mythical quick fix. Guess what, a five-minute shake weight workout while wearing a sauna suit isn't the path to a six-pack. You know what will work? Developing a simple, sustainable plan for healthy eating and regular exercise and sticking to it.
Investing is really no different. It is one part process and one part discipline.
Recently AQR’s Cliff Asness had this to say regarding Warren Buffett and his phenomenal success:
“I used to think being great at investing long-term was about genius. Genius is still good, but more and more I think it’s about doing something reasonable, that makes sense, and then sticking to it with incredible fortitude through tough times.
Of course [AQR] found [Warren Buffett] was fantastic – but not quite as fantastic. His track record was phenomenal…but human phenomenal.
What was beyond human was him sticking with it for 35 years and rarely, if ever, really retreating from it.
That was a nice little lesson that you have to be good, even very good, but sticking with it and not getting distracted is much more the job.”
Going one-step further, we think that it is important to remember that investing is a team sport. Yes, a manager needs to have the conviction to stick with his approach. However, it is equally important that the client has the discipline to stick with the manager.
I think the Buffett example is particularly interesting since he may be one of the closest examples we have to an omnipotent stock picker.
The Oracle of Omaha
Unsurprisingly, Buffett’s raw performance statistics are phenomenal. Berkshire Hathaway trounces the Vanguard S&P 500 Index Fund.
Buffett Summary Statistics (1980 to 2016)
| Berkshire Hathaway (ticker: BRK-A) |
Vanguard S&P 500 Index Fund (ticker: VFINX) |
|
|---|---|---|
| CAGR | 20.3% | 10.4% |
| Standard Deviation | 22.8% | 15.6% |
| Downside Deviation | 20.2% | 17.6% |
| Sharpe Ratio | 0.65 | 0.31 |
| Sortino Ratio (MAR=5%) | 0.76 | 0.30 |
| Worst Drawdown | 44.5% | 51.0% |
| Ulcer Index | 12.1 | 14.1 |
| Worst Month Return | -21.2% | -21.7% |
| Best Month Return | 30.0% | 13.3% |
| % Profitable Months | 61.4% | 63.5% |
| Source: Yahoo! Finance, Newfound Research. Past performance is not a guarantee of future results. | ||
Yet, for an investor to fully capitalize on Buffett’s genius, she would have needed the wherewithal to stay invested through grueling periods of absolute and relative underperformance.
Buffett's Large Drawdowns (1980 to 2016)
| Rank | Date of Top | Date of Bottom | BRK-A | VFINX | BRK-A Out / Underperformance |
|---|---|---|---|---|---|
| 1 | Dec. 2007 | Feb. 2009 | -44.5% | -48.5% | +4.0% |
| 2 | Jun. 1998 | Feb. 2000 | -43.8% | 23.3% | -67.1% |
| 3 | Dec. 1989 | Sep. 1990 | -32.3% | -11.2% | -21.1% |
| 4 | Sep. 1987 | Nov. 1987 | -31.3% | -28.1% | -3.2% |
| 5 | Nov. 1981 | Jul. 1982 | -17.4% | -15.2% | -2.2% |
| 6 | Mar. 1986 | Sep. 1986 | -15.9% | -1.8% | -14.1% |
| 7 | Nov. 1985 | Jan. 1986 | -14.1% | -1.8% | -12.3% |
| 8 | Feb. 1996 | May 1996 | -14.1% | 5.1% | -19.1% |
| 9 | Dec. 2014 | Jan. 2016 | -14.0% | -3.8% | -10.2% |
| 10 | Feb. 2004 | Sep. 2005 | -13.2% | 10.2% | -23.4% |
| Source: Yahoo! Finance, Newfound Research. Past performance is not a guarantee of future results. | |||||
“Has the world’s most famous investor lost his Midas touch?”
Imagine time traveling back to February 2000. Berkshire Hathaway has just lost nearly 44% of its value over the preceding 20 months. A low-cost index fund trounced the Oracle of Omaha by 67%.
Berkshire’s lone acquisition in 1999 was Jordan Furniture. Not exactly sexy in the midst of the dotcom boom.
A Motley Fool article from 2000 cited this critical email from a Berkshire Hathaway investor (emphasis is ours):
“We are holders of Berkshire Hathaway – quite a bit of it in fact, as my wife works at Gen Re. How do you explain Buffett’s oft-repeated contention that he does not understand technology stocks and therefore does not own them? What is difficult to understand about technology, especially a stock like Microsoft, where Buffett and Gates are known to be good friends? If anything, Buffett should have bought Microsoft, since it is a ‘toll-collector’ like many of his other companies. Moreover, how can he ignore technology stocks given their growing role in the economy? I think Buffett is becoming a bit of a relic by refusing to take time to learn about technology stocks.”
Buffett was even critical of himself in his 1999 letter to shareholders. He wrote:
“We had the worst absolute performance of my tenure and, compared to the S&P, the worst relative performance as well. Relative results are what concern us: Over time, bad relative numbers will produce unsatisfactory results.
Even Inspector Clouseau could find last year’s guilty party: your Chairman. My performance reminds me of a quarterback whose report card showed four Fs and a D but who nonetheless had an understanding coach. “Son,” he drawled, “I think you’re spending too much time on that one subject.”
My “one subject” is capital allocation, and my grade for 1999 most assuredly is a D.”
Nevertheless, Buffett was steadfast in sticking to his process. Later in the same letter, he wrote:
“Our lack of tech insights, we should add, does not distress us. After all, there are a great many business areas in which Charlie and I have no special capital-allocation expertise. For instance, we bring nothing to the table when it comes to evaluating patents, manufacturing processes or geological processes. So we simply don’t get into judgments in those fields.
If we have a strength, it is recognizing when we are operating well within our circle of competence and when we are approaching the perimeter. Predicting the long-term economics of companies that operate in fast-changing industries is simply far beyond our perimeter. If others claim predictive skill in those industries -- and seem to have their claims validated by the behavior of the stock market -- we neither envy nor emulate them. Instead, we just stick with what we understand. If we stray, we will have done so inadvertently, not because we got restless and substituted hope for rationality. Fortunately, it's almost certain there will be opportunities from time to time for Berkshire to do well within the circle we've staked out.”
Would you have had the discipline to stick with Warren? It certainly would have required guts, the ability to ignore short-term performance, and the foresight to recognize a manager dedicated to a sound, thoughtful investment process. If so, you would have been handsomely rewarded. Berkshire more than quadrupled in value from February 2000 to January 2016. The Vanguard index fund didn’t even double.
From Stock Picking to Asset Allocation
After reading Alpha Architect’s article, I was curious to see how their omnipotent investor would have faired as an asset allocator.
To find out, we used data from Robert Shiller's website to construct U.S. stock and bond indices going back to 1871.
We computed forward 5-year total returns for stocks and bonds. The omnipotent investor allocates to the asset class with the best forward 5-year return. The portfolio is rebalanced on January 31st every fifth year.
Take January 31st, 1876 as an example. The 5-year forward return – from January 31st, 1876 to January 31st, 1881 – for stocks is 108.3% and for bonds is 63.3%. Since stocks beat bonds, the omnipotent investor will hold stocks from January 31st, 1876 to January 31st 1881, locking in the 108.3%. We explicitly use look-ahead bias.
Just like the omnipotent stock picker, our omnipotent asset allocator easily outperforms over the long run.
Summary Statistics (1876 to 2010)
| U.S. Stocks | 50/50 U.S. Stocks / U.S. Bonds |
5-Year High Forward Return | |
|---|---|---|---|
| CAGR | 8.9% | 7.3% | 9.8% |
| Standard Deviation | 14.5% | 7.5% | 10.0% |
| Downside Deviation | 16.0% | 7.7% | 12.3% |
| Sharpe Ratio | 0.28 | 0.33 | 0.50 |
| Sortino Ratio (MAR=5%) | 0.25 | 0.30 | 0.50 |
| Worst Drawdown | 81.8% | 51.5% | 47.5% |
| Ulcer Index | 17.9 | 7.5 | 11.7 |
| Worst Month Return | -26.2% | -14.0% | -26.2% |
| Best Month Return | 51.3% | 17.5% | 11.6% |
| % Profitable Months | 62.0% | 64.6% | 73.0% |
| Source: Robert Shiller's Online Data, Newfound Research. The results are hypothetical and backtested returns that explicitly utilize look-ahead bias in their calculation. Results are not indicative of any Newfound index or strategy. Hypothetical performance results have many inherent limitations and are not indicative of results that any investor actually attained. An investor cannot invest directly in an index. Index returns are unmanaged and do not reflect fees and expenses. The methodology for calculating these results is available upon request. | |||
However, the price of admission to this great long-term ride was quite a bit of short-term heartburn. In fact, this heartburn was probably so severe that it would have been quite hard for our investor to build a sustainable asset management business.
Large Drawdowns (1876 to 2010)
| Rank | Date of Top | Date of Bottom | 5-Year High Forward Return |
50/50 Stock / Bond |
Out / Under- Performance |
|---|---|---|---|---|---|
| 1 | Sep. 1929 | Dec. 1930 | -47.5% | -26.1% | -21.5% |
| 2 | Sep. 1906 | Nov. 1907 | -33.9% | -15.9% | -18.0% |
| 3 | Mar. 1876 | Jun. 1877 | -33.1% | -14.3% | -18.8% |
| 4 | Aug. 1987 | Dec. 1987 | -26.0% | -14.7% | -11.3% |
| 5 | Sep. 1902 | Jan. 1903 | -25.7% | -12.1% | -13.7% |
| 6 | Dec. 1961 | Jun. 1962 | -21.2% | -9.1% | -12.1% |
| 7 | May 1946 | May 1947 | -19.8% | -9.8% | -10.0% |
| 8 | Oct. 1912 | Dec. 1914 | -15.7% | -3.0% | -12.7% |
| 9 | Jul. 1957 | Nov. 1957 | -15.7% | -6.8% | -8.9% |
| 10 | Jul. 1990 | Oct. 1990 | -13.9% | -6.9% | -7.0% |
| Source: Robert Shiller's Online Data, Newfound Research. The results are hypothetical and backtested returns that explicitly utilize look-ahead bias in their calculation. Results are not indicative of any Newfound index or strategy. Hypothetical performance results have many inherent limitations and are not indicative of results that any investor actually attained. An investor cannot invest directly in an index. Index returns are unmanaged and do not reflect fees and expenses. The methodology for calculating these results is available upon request. | |||||
If we narrow our focus to a single timeframe, however, the surprising amount of risk experienced by the omnipotent investor becomes much less perplexing. Take the Great Depression drawdown – from September 1929 to December 1930 – as an example.
The last rebalance date prior to the 1929 crash occurred in January 1926. The 5-year forward returns for stocks and bonds from January 1926 to January 1931 were 58.1% and 22.0%, respectively.
Of course, the omnipotent investor – since he is omnipotent – makes the right call, allocating 100% of capital to stocks. However, the path to a 58.1% gain for stocks was not smooth. Stocks nearly doubled from the beginning of the period through September 1929, only to subsequently see their value cut in half as depression took hold of the global economy.
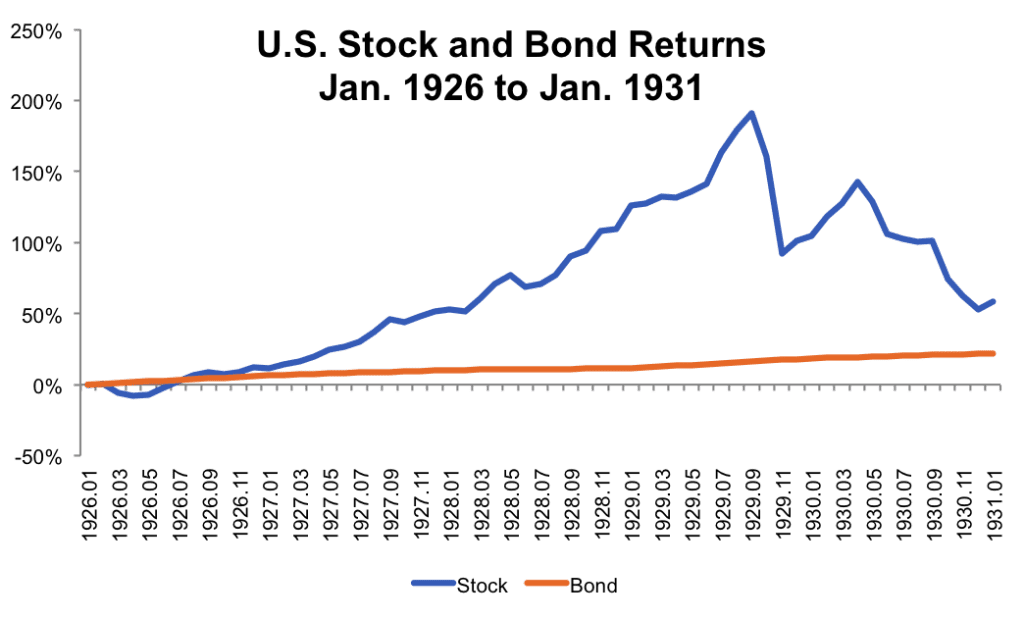 Source: Robert Shiller's Online Data, Yahoo! Finance
With this example, we can identify two issues.
First, in the hypothetical world that Alpha Architect constructed, the only criteria considered in the investment process is return. There is no consideration for risk. If we do not penalize risk in the portfolio construction process, there is no reason to believe that portfolio returns will necessarily exhibit a reduced risk profile.
Second, we see that timing luck is coming into play since we are locking the investor into his decision for five years. Had the investor happened to be on a cycle that rebalanced at the market peak in September 1929, he would have allocated to bonds and significantly reduced the loss of capital.
Taking Risk Into Account
In this section, we amend our experiment to take risk into account. We still measure forward 5-year returns. But we also measure forward 5-year maximum drawdowns. If an asset class has a drawdown greater than 25% in the next 5-years, we eliminate it. If both stocks and bonds both pass this screen, then we allocate to the asset class with the highest 5-year forward return.
The omnipotent investor still wants the highest return, but only if it comes with what he deems to be acceptable downside risk. He is willing to lower return in exchange for lower drawdowns. After all, he has investors to keep happy.
As expected, the new risk-aware methodology decreases volatility and drawdown. These reductions come at the price of lower returns, although returns are still higher than the 50/50 stock bond benchmark.
Summary Statistics Accounting for Risk (1876 to 2010)
| U.S. Stocks | 50/50 U.S. Stocks / U.S. Bonds |
5 Year High Forward Return |
5 Year High Forward Return - Risk Conscious |
|
|---|---|---|---|---|
| CAGR | 8.9% | 7.3% | 9.8% | 8.9% |
| Standard Deviation | 14.5% | 7.5% | 10.0% | 7.8% |
| Downside Deviation | 16.0% | 7.7% | 12.3% | 9.3% |
| Sharpe Ratio | 0.28 | 0.33 | 0.50 | 0.52 |
| Sortino Ratio (MAR=5%) | 0.25 | 0.30 | 0.50 | 0.60 |
| Worst Drawdown | 81.8% | 51.5% | 47.5% | 21.2% |
| Ulcer Index | 17.9 | 7.5 | 11.7 | 3.8 |
| Worst Month Return | -26.2% | -14.0% | -26.2% | -14.4% |
| Best Month Return | 51.3% | 17.5% | 11.6% | 11.6% |
| % Profitable Months | 62.0% | 64.6% | 73.0% | 78.3% |
| Source: Robert Shiller's Online Data, Newfound Research. The results are hypothetical and backtested returns that explicitly utilize look-ahead bias in their calculation. Results are not indicative of any Newfound index or strategy. Hypothetical performance results have many inherent limitations and are not indicative of results that any investor actually attained. An investor cannot invest directly in an index. Index returns are unmanaged and do not reflect fees and expenses. The methodology for calculating these results is available upon request. | ||||
The number of large drawdowns is certainly lower. By taking risk into account, we only have one drawdown greater than 20%. There were six such drawdowns when we were only accounting for return.
That being said, the table shows that there are still a number of periods with sizable relative performance drag.
Our omnipotent investor may have insulated his investors from the panic that large drawdowns can cause, but he hasn’t eliminated the chance that investors jump ship when they see their neighbors have a better year in the markets.
Large Drawdowns Accounting for Risk (1876 TO 2010)
| Rank | Date of Top | Date of Bottom | 5-Year Forward Return - Risk Conscious |
50/50 Stock / Bond |
Out- / Under- Performance |
|---|---|---|---|---|---|
| 1 | Dec. 1961 | Jun. 1962 | -21.2% | -9.1% | -12.1% |
| 2 | Sep. 1941 | Apr. 1942 | -19.8% | -10.2% | -9.6% |
| 3 | May 1946 | May 1947 | -19.8% | -9.8% | -10.0% |
| 4 | Oct. 1912 | Dec. 1914 | -15.7% | -3.0% | -12.7% |
| 5 | Jul. 1957 | Nov. 1957 | -15.7% | -6.8% | -8.9% |
| 6 | Mar. 1923 | Jul. 1923 | -12.8% | -5.5% | -7.3% |
| 7 | Apr. 1896 | Aug. 1896 | -12.5% | -5.3% | -7.3% |
| 8 | Jul. 1998 | Sep. 1998 | -11.5% | -3.4% | -8.1% |
| 9 | Dec. 1976 | Feb. 1978 | -10.4% | -5.0% | -5.4% |
| 10 | Aug. 2000 | Dec. 2000 | -10.1% | -1.9% | -8.1% |
| Source: Robert Shiller's Online Data, Newfound Research. The results are hypothetical and backtested returns that explicitly utilize look-ahead bias in their calculation. Results are not indicative of any Newfound index or strategy. Hypothetical performance results have many inherent limitations and are not indicative of results that any investor actually attained. An investor cannot invest directly in an index. Index returns are unmanaged and do not reflect fees and expenses. The methodology for calculating these results is available upon request. | |||||
Taking Timing Into Account
In our first example, we rebalanced in five-year increments offset from January 31st, 1876 (i.e. we rebalance January 31st, 1876, January 31st 1881, January 31st, 1886, etc.).
Since we rebalance every five years and have monthly data, there are actually sixty different rebalance offsets – or “vintages” - we can use.
The scatterplot below plots the annualized return and maximum drawdown for each vintage.
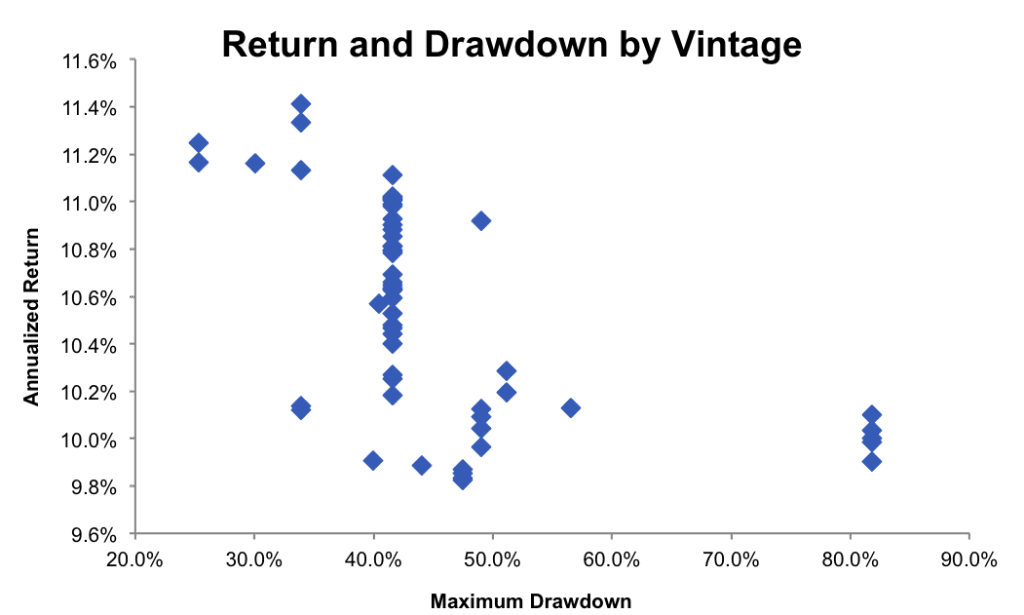
Source: Robert Shiller's Online Data, Newfound Research. The results are hypothetical and backtested returns that explicitly utilize look-ahead bias in their calculation. Results are not indicative of any Newfound index or strategy. Hypothetical performance results have many inherent limitations and are not indicative of results that any investor actually attained. An investor cannot invest directly in an index. Index returns are unmanaged and do not reflect fees and expenses. The methodology for calculating these results is available upon request.
Depending on vintage, the annualized return varies between 9.82% and 11.41%. Maximum drawdown has an an even larger range – varying from 25.3% on the low end to 81.8% on the high end.
If the omnipotent investor decides to pick one of these vintages, then he is like the first oenophile in our “The Three Oenophiles” commentary.
The Third Oenophile
So what is the omnipotent investor to do? Well, if he was truly omnipotent he could just pick the vintage with the desired risk and/or return profile.
But what if we impose an additional constraint. Namely, the investor’s crystal ball can only spit out forward 5-year returns. The investor knows nothing about how stocks or bonds will behave over shorter or longer time horizons.
With this more limited set of information, the investor has no way to know which vintage will be best.
So what should he do? He should take a lesson from the third oenophile and put 1/60th of his capital into each vintage. Operationally, this would mean:
- Dividing the initial capital into 60 equal sleeves
- Investing each sleeve in the asset class with the highest 5-year forward return, with each sleeve rebalancing on a rolling basis. The first sleeve would rebalance in month 1, the second in month 2, the third in month three, and so on. In month 61, we would return to sleeve one, rebalancing it five years after it was last invested.
- Periodically rebalancing the sleeves back to equal weight so that we do not become overly exposed to certain vintages that have performed well historically.
Summary Statistics - Third Oneophile (1876 to 2010)
| U.S. Stocks | 50/50 U.S. Stocks / U.S. Bonds |
5 Year High Forward Return |
5 Year High Forward Return - Third Oneophile |
|
|---|---|---|---|---|
| CAGR | 8.9% | 7.3% | 9.8% | 10.7% |
| Standard Deviation | 14.5% | 7.5% | 10.0% | 9.5% |
| Downside Deviation | 16.0% | 7.7% | 12.3% | 9.5% |
| Sharpe Ratio | 0.28 | 0.33 | 0.50 | 0.62 |
| Sortino Ratio (MAR=5%) | 0.25 | 0.30 | 0.50 | 0.61 |
| Worst Drawdown | 81.8% | 51.5% | 47.5% | 28.0% |
| Ulcer Index | 17.9 | 7.5 | 11.7 | 6.4 |
| Worst Month Return | -26.2% | -14.0% | -26.2% | -14.4% |
| Best Month Return | 51.3% | 17.5% | 11.6% | 11.5% |
| % Profitable Months | 62.0% | 64.6% | 73.0% | 65.3% |
| Source: Robert Shiller's Online Data, Newfound Research. The results are hypothetical and backtested returns that explicitly utilize look-ahead bias in their calculation. Results are not indicative of any Newfound index or strategy. Hypothetical performance results have many inherent limitations and are not indicative of results that any investor actually attained. An investor cannot invest directly in an index. Index returns are unmanaged and do not reflect fees and expenses. The methodology for calculating these results is available upon request. | ||||
Large Drawdowns - Third Oneophile (1876 to 2010)
| Rank | Date of Top | Date of Bottom | 5 Year High Forward Return - Third Oneophile |
50/50 Stock / Bond |
Out- / Under- Performance |
|---|---|---|---|---|---|
| 1 | Sep. 1906 | Nov. 1907 | -28.1% | -15.9% | -12.2% |
| 2 | Mar. 1937 | Apr. 1942 | -25.0% | -15.3% | -9.7% |
| 3 | Aug. 1987 | Dec. 1987 | -24.0% | -14.7% | -9.3% |
| 4 | Sep. 1902 | Oct. 1903 | -22.5% | -12.1% | -10.5% |
| 5 | Sep. 1929 | Jun. 1932 | -21.7% | -51.5% | +29.8% |
| 6 | Dec. 1961 | Jun. 1962 | -21.2% | -9.1% | -12.1% |
| 7 | May 1946 | May 1947 | -19.8% | -9.8% | -10.0% |
| 8 | Dec. 1968 | May 1970 | -18.6% | -14.7% | -3.9% |
| 9 | Nov. 1916 | Dec. 1917 | -16.0% | -13.1% | -2.8% |
| 10 | Jul. 1957 | Nov. 1957 | -15.7% | -6.8% | -8.9% |
| Source: Robert Shiller's Online Data, Newfound Research. The results are hypothetical and backtested returns that explicitly utilize look-ahead bias in their calculation. Results are not indicative of any Newfound index or strategy. Hypothetical performance results have many inherent limitations and are not indicative of results that any investor actually attained. An investor cannot invest directly in an index. Index returns are unmanaged and do not reflect fees and expenses. The methodology for calculating these results is available upon request. | |||||
Directionally, the results are unchanged. The omnipotent investor delivers strong outperformance, but there are more than enough periods of absolute and relative underperformance for him to be fired many times over by his clients.
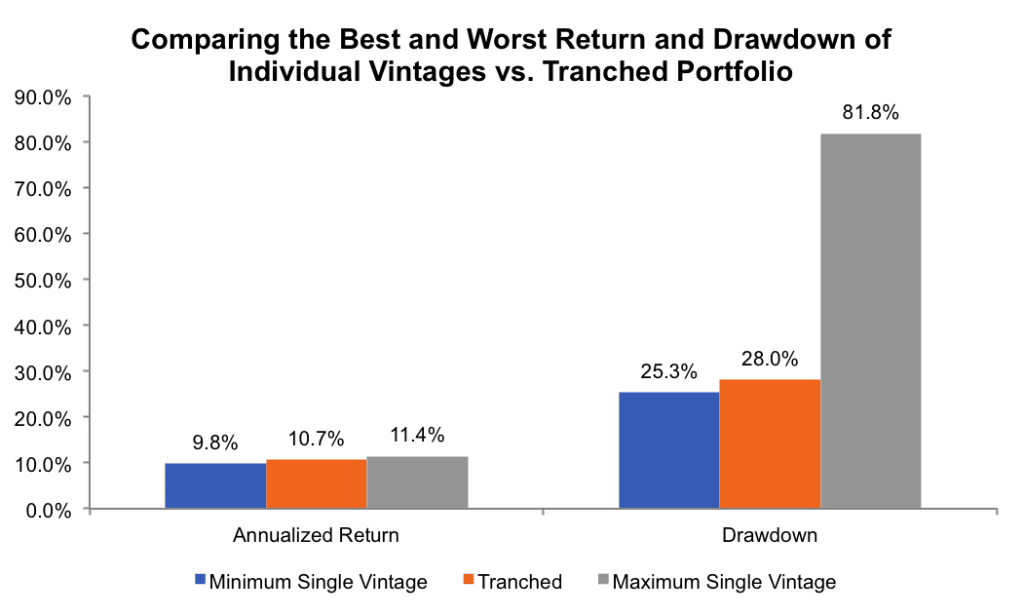
What is fascinating is that by taking a lesson from the third oenophile, the investor essentially eliminates any timing – or vintage – risk without needing to employ any look-ahead bias. The tranched portfolio - tranching is what we call this process of diversifying across vintages - delivers a return that is higher than 35 of the 60 individual vintages and remarkably delivers a drawdown that is lower than 58 of the 60 individual vintages.
Source: Robert Shiller's Online Data, Newfound Research. The results are hypothetical and backtested returns that explicitly utilize look-ahead bias in their calculation. Results are not indicative of any Newfound index or strategy. Hypothetical performance results have many inherent limitations and are not indicative of results that any investor actually attained. An investor cannot invest directly in an index. Index returns are unmanaged and do not reflect fees and expenses. The methodology for calculating these results is available upon request.
Conclusions
- If you want long-term outperformance, you must be able to stomach short-term underperformance - even if your manager is omnipotent. As William Bernstein said, "The most important investment ability of all is emotional discipline."
- If you care about risk management, then you must explicitly consider it in your investment process. Alpha is not a risk management policy.
- Most successful investment strategies are looking to harvest one or more risk premia. These risk premia take time to mature, just like a fine wine. Your rebalancing methodology must be aligned time you expect it will take for the premia to mature. Fully rebalancing a deep value portfolio each month makes no sense. With patience, however, comes timing risk - the risk that you are unlucky in how your rebalances happen to line up with market movements. Tranching - or diversifying across vintages with offset rebalance dates - can largely mitigate this risk.