by Don Vialoux, Timingthemarket.ca
Editor’s Note: Mr. Vialoux is scheduled to appear this evening at 6:00 PM EST on BNN’s Market Call Tonight.
StockTwits Released Yesterday @EquityClock
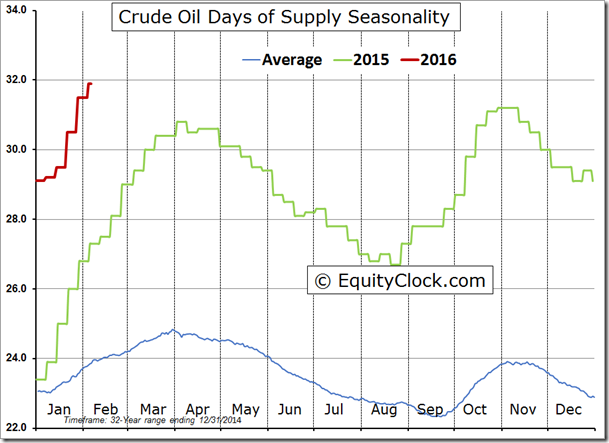
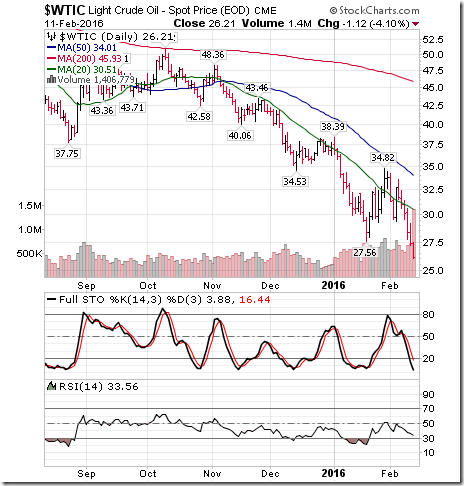
Price of oil hits multi-year low as the days of supply rises to another multi-decade high.
Technical action by S&P 500 stocks to 10:00: Bearish. 20 S&P 500 stocks broke intermediate support and one stock $CSCO broke resistance.
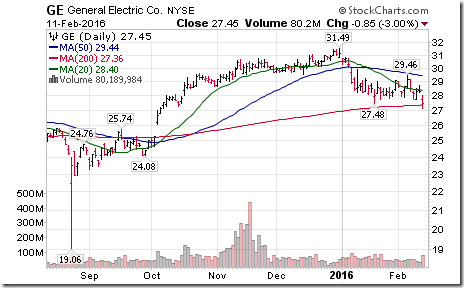
Editor’s Note: After 10:00, two more stocks broke support: M&T Bank and General Electic
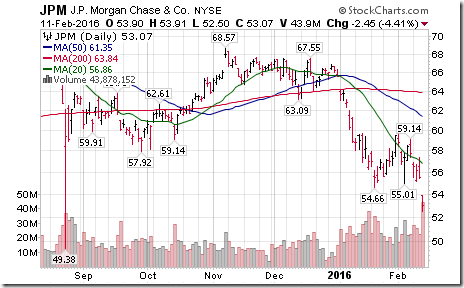
Notably weaker were U.S. Financials. Breakdowns: $JPM, $MAC, $PLD, $RF, $NAVI, $USB
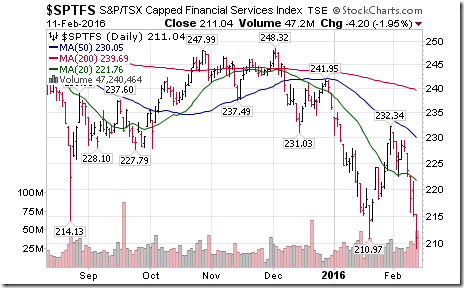
TSX Financial Index broke support at 210.97 to reach a 30 month low resuming an intermediate downtrend.
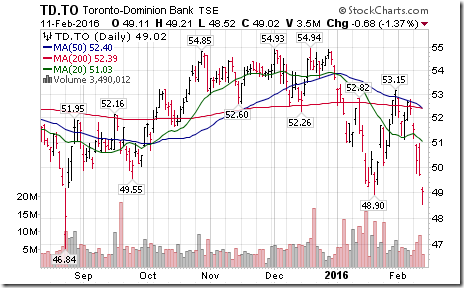
$TD.CA broke support at $48.90 to resume an intermediate downtrend.
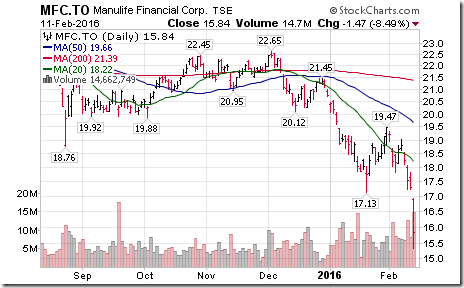
Manulife $MFC.CA broke support at $17.13 resuming an intermediate downtrend and reaching a 30 month low.
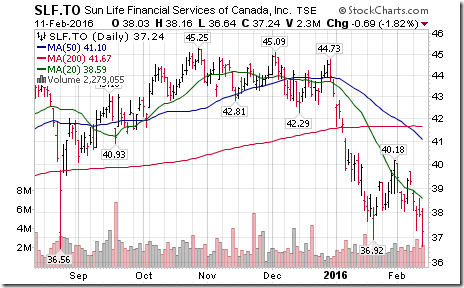
SunLife $SLF.CA broke support at $36.92 resuming an intermediate downtrend.
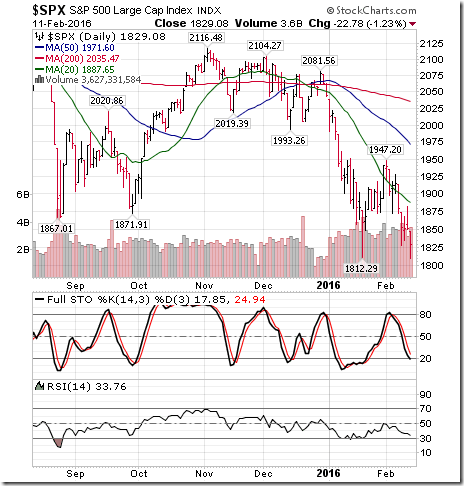
S&P 500 Index moved below 1812 set on January 21st
Editor’s Note: The Index touched a low of 1810, but quickly recovered on rumors that OPEC is willing to negotiate a crude oil supply constraint. Short term momentum indicators already are oversold, but have yet to show signs of bottoming.
Interesting Charts
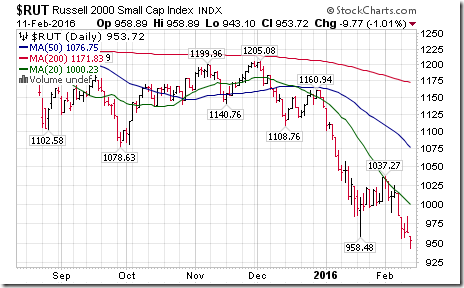
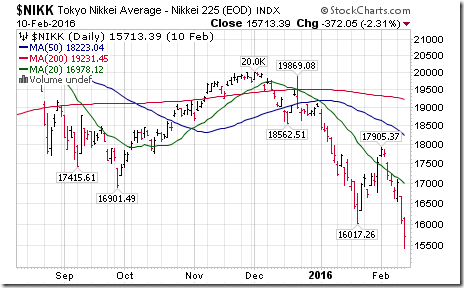
Several equity indices broke to new low with the S&P 500 Index
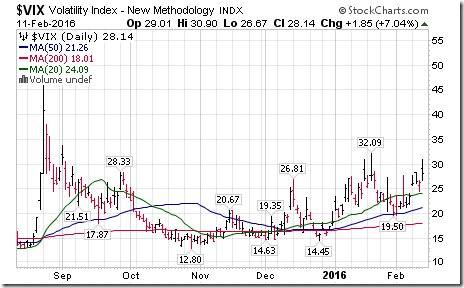
The VIX spiked, but remains below its January 21st level.
The breakdown by crude oil was one of the triggers for greater volatility and equity market weakness. Short term momentum indicators already are deeply oversold, but have yet to show signs of bottoming.
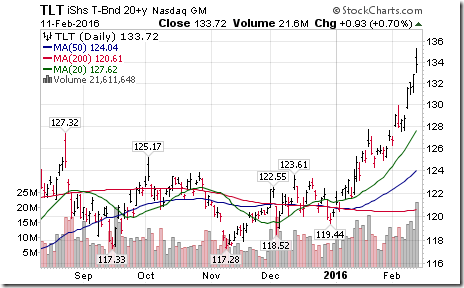
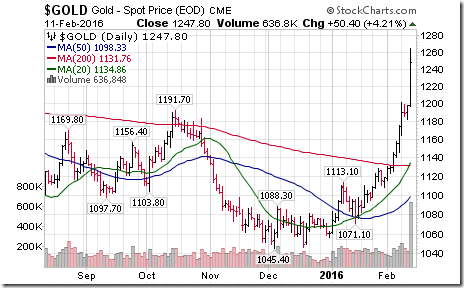
A flight to safety!
Trader’s Corner
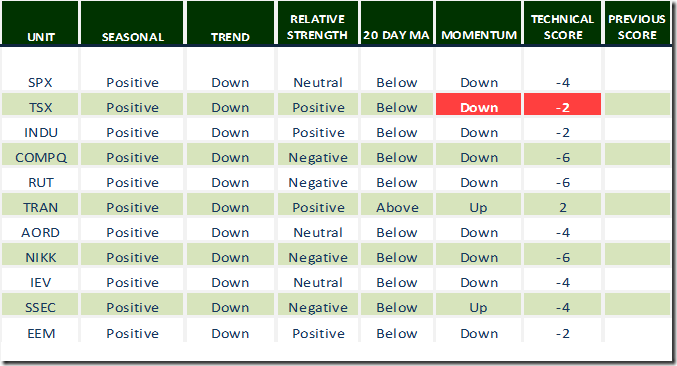
Daily Seasonal/Technical Equity Trends for February 11th 2016
Green: Increase from previous day
Red: Decrease from previous day
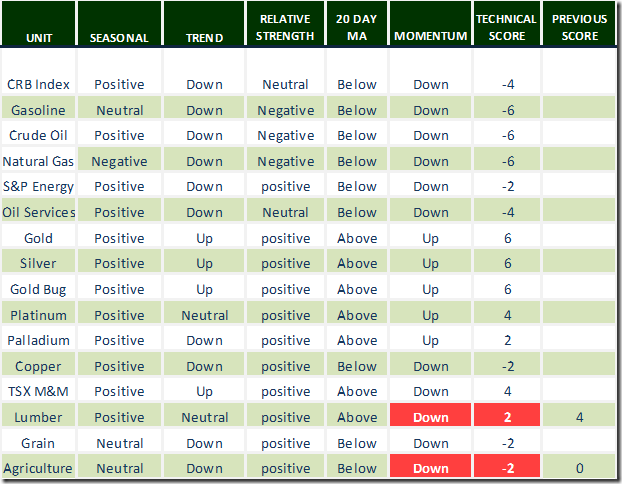
Daily Seasonal/Technical Commodities Trends for February 11th 2016
Green: Increase from previous day
Red: Decrease from previous day
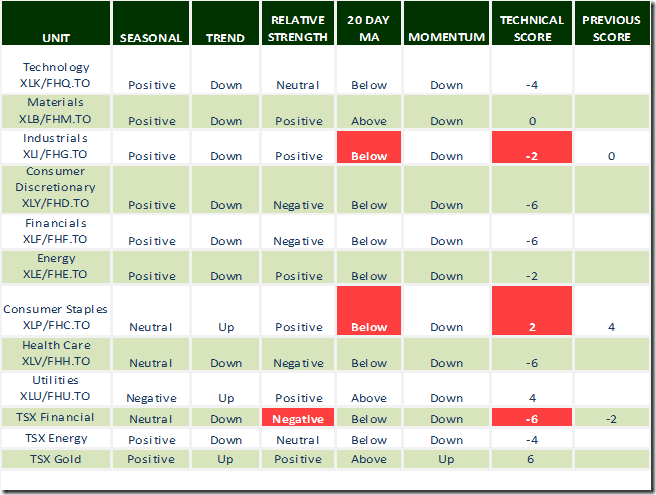
Daily Seasonal/Technical Sector Trends for February 11th 2016
Green: Increase from previous day
Red Decrease from previous day
Special Free Services available through www.equityclock.com
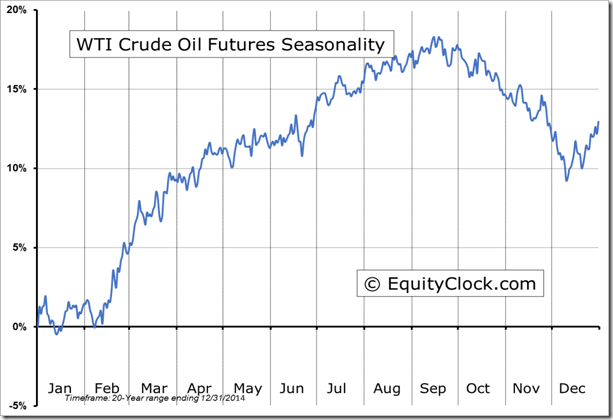
Equityclock.com is offering free access to a data base showing seasonal studies on individual stocks and sectors. The data base holds seasonality studies on over 1000 big and moderate cap securities and indices. To login, simply go to http://www.equityclock.com/charts/ Following is an example:
Editor’s Note: Crude oil has a history of reaching a seasonal low at this time of year
Disclaimer: Seasonality and technical ratings offered in this report by www.timingthemarket.ca and www.equityclock.com are for information only. They should not be considered as advice to purchase or to sell mentioned securities. Data offered in this report is believed to be accurate, but is not guaranteed
Copyright © DV Tech Talk, Timingthemarket.ca


