by Don Vialoux, Timingthemarket.ca
StockTwits released yesterday
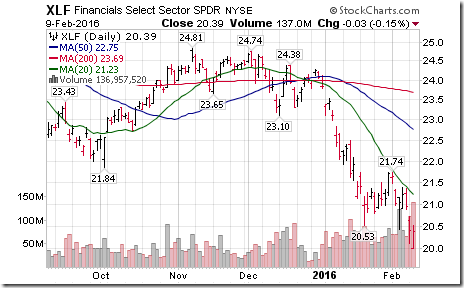
Financials falter as Treasury yields touch 52 week lows.
Technical action by S&P 500 stocks to 10:30: Bearish. Breakdowns: $DISCA, $VIAB, $CMA, $LUK, $VTR, $ZION, $AMAT. Breakout: $MLM.
Editor’s Note: After 10:30 AM EST, breakout was CHD and breakdowns were FTI, YUM, TWX, CB and MRO.
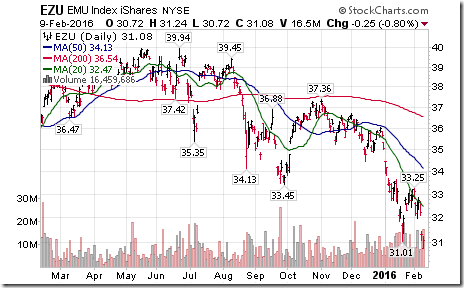
Big cap Europe ETF $EZU broke support to reach a 30 month low.
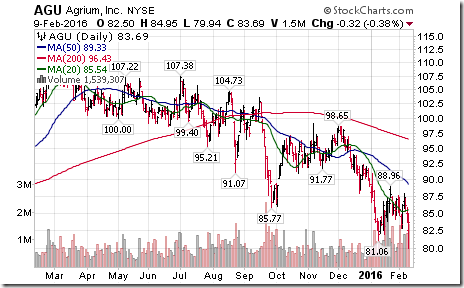
Agrium $AGU broke support at $81.06 to extend an intermediate downtrend following release of quarterly results.
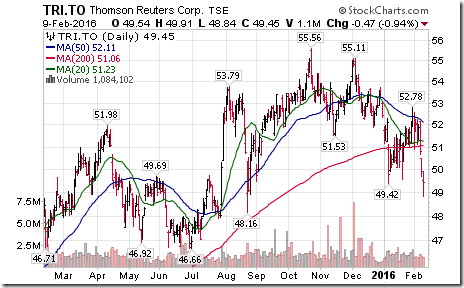
Thomson Reuters $TRI broke support at $49.42 to extend an intermediate downtrend.
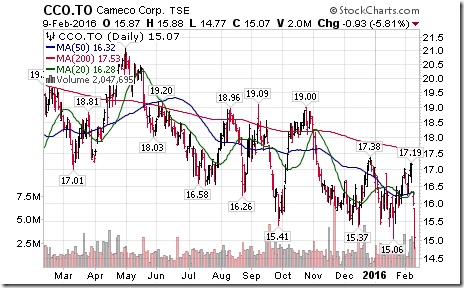
Cameco $CCO.CA extended an intermediate downtrend on a break below $15.06 to reach a 7 year low.
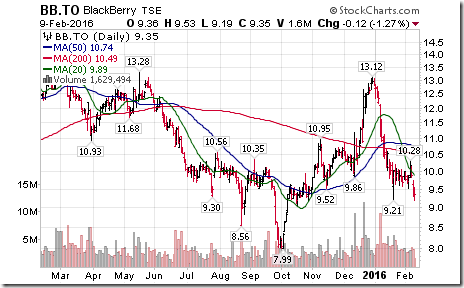
BlackBerry $BB.CA extended an intermediate downtrend on a break below support at $9.21.
Trader’s Corner
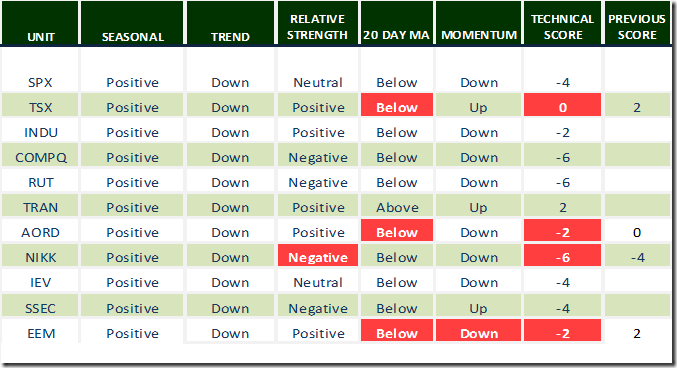
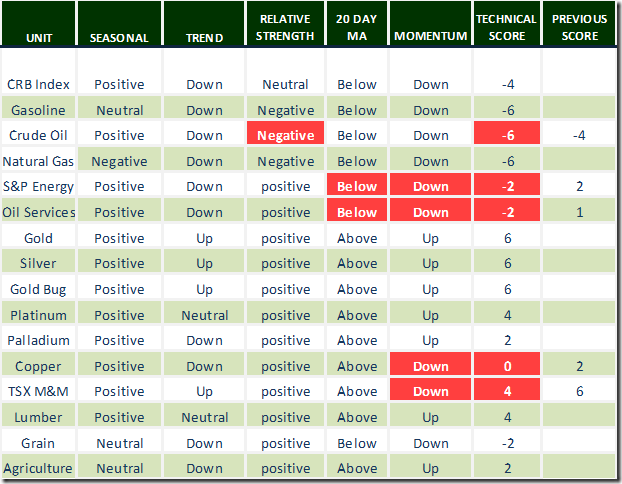
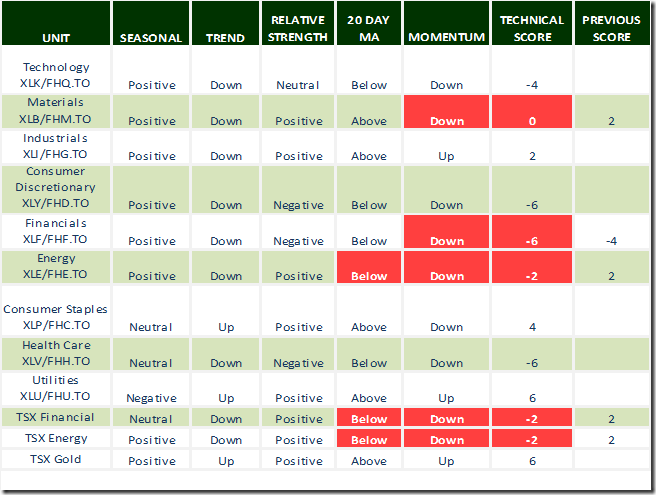
Technical scores slipped yesterday when markets, commodities and sectors broke below their 20 day moving averages and short term momentum indicators rolled over from overbought levels.
Daily Seasonal/Technical Equity Trends for February 9th 2016
Green: Increase from previous day
Red: Decrease from previous day
Daily Seasonal/Technical Commodities Trends for February 9th 2016
Green: Increase from previous day
Red: Decrease from previous day
Daily Seasonal/Technical Sector Trends for February 9th 2016
Green: Increase from previous day
Red Decrease from previous day
Interesting Charts
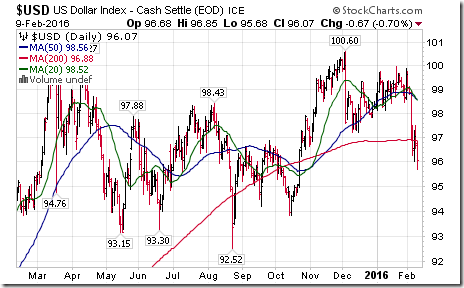
The U.S. Dollar Index remains under intense pressure, good news for commodity prices. Traders are guessing that Janet Yellen will hint at a deferral of another increase in the Fed Fund rate.
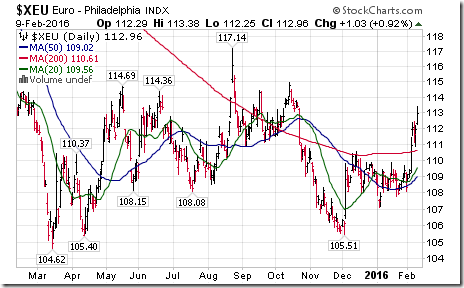
Conversely, the Euro continues to surge.
Special Free Services available through www.equityclock.com
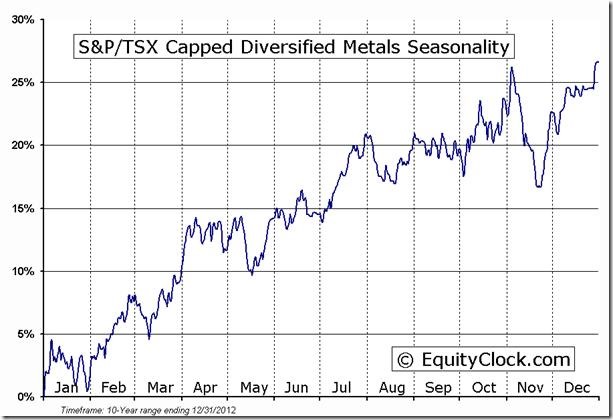
Equityclock.com is offering free access to a data base showing seasonal studies on individual stocks and sectors. The data base holds seasonality studies on over 1000 big and moderate cap securities and indices. To login, simply go to http://www.equityclock.com/charts/ Following is an example:
Disclaimer: Seasonality and technical ratings offered in this report by www.timingthemarket.ca and www.equityclock.com are for information only. They should not be considered as advice to purchase or to sell mentioned securities. Data offered in this report is believed to be accurate, but is not guaranteed
Copyright © DV Tech Talk, Timingthemarket.ca


