
Copper and the Metals and Mining Sector in China's Wake
For this week’s edition of the Equity Leaders Weekly, we are going to re-examine the Metals and Mining Markets and the price of economically sensitive metals such as Copper given the recent economic news coming out of China, the world’s second largest country.
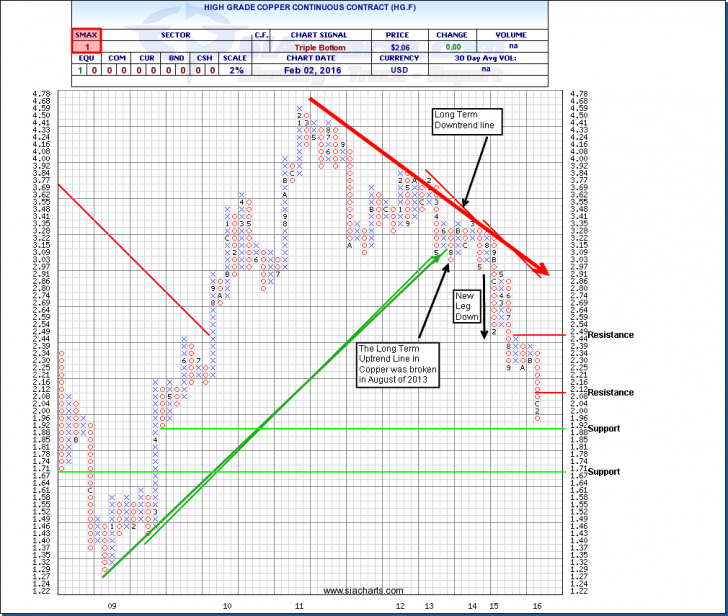
High Grade Copper Continuous Contract (HG.F)
The price of copper has fallen steadily since the beginning of 2011. In the past few months we have seen continued weakness in the price of copper. With a continued slowdown in China’s economy, the markets are justifiably concerned with the overall health of the global economy. Growth in China’s fourth quarter 2014 GDP slowed to 6.8%. Full year 2015 growth came in at 6.9%, down from 2014’s 7.3%. The IMF is forecasting China’s GDP to come in at 6.3% in 2016 and 6.0% in 2017, which indicates even further slowdowns are still in play. We have also seen weak China PMI numbers for January which have been the lowest since mid-2012. It will be interesting to see if there are any signs of whether China’s economy will continue to fade or if their economy can begin to show signs of stabilizing. In addition to these weak Chinese economic numbers. In January the U.S. announced some weak economic data with U.S. retail sales falling in December, as well as falling Industrial Production. With concerns of economic weakness coming out of the world’s two largest economies, let’s examine the chart of copper, a very economically sensitive base metal.
In looking at the chart of copper (HG.F), we see that copper reached a top in late 2010 and has slowly fallen since then. It broke its long term trend line in August 2013 at $3.03. A new leg down ensued in the price of copper starting in December of 2014 up until today. We have just broken through a previous support level at $2.12. There is minor support at $1.88. If it does not hold $1.88, the next level of support is at $1.71 (approaching levels we have not seen since the 2008-2009 Global Recession). To the upside, resistance is now found at $2.12 and, above that, the $2.49 area.
In hindsight to all this, what we must always consider is the long term supply demand relationship as dictated by our relative strength analysis. Copper is down 35% in the past year alone, and 60% since the high in late 2010. Also keep in mind the Commodity Asset Class has been at or near the bottom of the asset class ranking list since October 2012. If you delve down in further detail within the asset class rank list, you will see Commodities is currently in the fifth spot. However, the strength within the Commodity Class is being attributed to the Precious Metals Sector and not the economically sensitive commodities as you can see by looking at the Sector column within the Asset Class rank list. Overall, the Commodity asset class as a whole remains quite weak. As a result, paying attention to our top down “macro” indicator, the asset class rank list is very important.
Click on Image to Enlarge
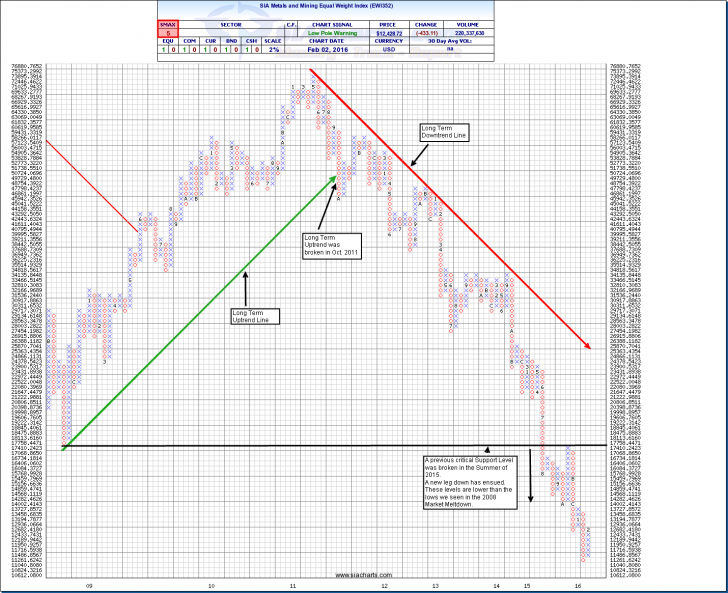
SIA Metals and Mining Equal Weight Index (EWI 352)
Let’s now examine the SIA Metals and Mining Index during this same time frame. The SIA Metals and Mining Equal Weight Index (found in the stock sectors tab within the reports tab) are comprised of the 44 most liquid Metals and Mining Names in Canada and the U.S. Given the continued weakness in copper prices since the end of 2010, it is no surprise you can see the EWI352 has been in a precipitous decline since almost the same time frame (May 2011). The long term trend line was broken in October 2011 and a steady downtrend has ensued all the way up to today. A key support level was broken at the 17,410.2423 back in the summer of 2015. This key prior support level was the 2008 Global Financial Meltdown. As a result, the Metals and Mining EWI is at levels even lower than the 2008 market meltdown. In looking further at the chart, we see that levels may continue even further downwards. For example, in looking at some more Copper Oriented names within the EWI352, we see that Hudbay Minerals has lost more than 73% in the past year. First Quantum, another copper oriented component within the SIA Metals and Mining Equal Weight Index, is down more than 78% in the past year. These two examples remind us why it is important as a risk manager to take a top down approach, first, using the Asset Class Rank List and then assessing the Market Sector report found under the Stock Sector tab.
Click on Image to Enlarge
SIACharts.com specifically represents that it does not give investment advice or advocate the purchase or sale of any security or investment. None of the information contained in this website or document constitutes an offer to sell or the solicitation of an offer to buy any security or other investment or an offer to provide investment services of any kind. Neither SIACharts.com (FundCharts Inc.) nor its third party content providers shall be liable for any errors, inaccuracies or delays in content, or for any actions taken in reliance thereon.
For a more in-depth analysis on the relative strength of the equity markets, bonds, commodities, currencies, etc. or for more information on SIACharts.com, you can contact our customer support at 1-877-668-1332 or siateam@siacharts.com.
Copyright © SIACharts.com