
Tactical Alpha Part III: Asset Allocation vs. Security Selection
by Adam Butler, GestaltU.com
Asset Allocation, Asset Allocation, Asset Allocation!
Note: This series expands on the concepts discussed in our whitepaper, Tactical Alpha: A Quantitative Case for Active Asset Allocation. If you would like to skip ahead by reading the original paper, you can download it here.
The forest and the trees
By far the greatest source of personal consternation as a professional in markets is investors’ obsession with finding the best stocks, or the best stock pickers. The fact that investors pursue this objective at all undermines all meaningful arguments about efficient markets. After all, why on earth would the well informed, rational actors that constitute efficient markets spend all their time on the component of the investment process that is likely to make the least amount of difference to their long-term wealth?
You see, the ability to pick the best securities (for example, individual stocks and bonds) in a chosen market is almost irrelevant compared to one’s choice of market itself. Does it matter how well one can choose stocks from a market if that market is dramatically underperforming?
Consider the example of emerging market equities, which have underperformed U.S. equities by more than 55% over the past 5 years. And one need not go so far afield as emerging markets to find other examples with similarly large dispersion. Developed international markets also lagged U.S. stocks by a substantial margin. The Vanguard FTSE Developed Markets (ex-US) ETF (VEA) generated just 20% total return, or 3.7% per year, lagging US stocks by 8.4% annualized. Now, consider that the Vanguard US Total Stock Market ETF produced over 14% per year over the past 5 years. What is the likelihood that an investor – even a great investor – who chose stocks from non-US markets over the past five years was able to outperform even a poorly skilled manager selecting from U.S. stocks?
Figure 1.

To get a sense for the impact of stock picking in the individual markets, let’s examine the range of mutual fund outcomes for funds focused on each region. According to Reuters’ fund screener, the 95th percentile U.S. equity fund delivered 15.5% annualized over the past five years, while a 5th percentile fund produced about 8.8%. Meanwhile, active international equity mutual funds’ performance ranged from 5.7% to -1.7%. Incredibly, a 95th percentile manager in the emerging markets equity space delivered just 1.7% annualized over the past 5 years, while a 5th percentile fund lost over 7% per year.
Table 1.

Which means that even the worst stock pickers in US markets outperformed the best stock pickers in international developed markets, and the worst stock pickers in international developed markets performed as well as the best stock pickers in emerging markets.
In other words, portfolio outcomes are much less influenced by which funds you choose within a given market, than by which market you choose to invest in. Virtually any investor choosing to focus on U.S. stocks would have crushed any other investor who chose to diversify farther afield. And keep in mind that we have just focused on equity investments; investors who broadened their horizons to include government bonds, international bonds, credit, commodities, REITs, infrastructure, and other assets would have seen even greater dispersion.
The point is, while most investors and advisors spend all their time trying to pick the best stocks, or the best stock-pickers, these decisions mean almost nothing compared to decisions about asset allocation. At the best of times for stock-pickers asset allocation and stock-picking have about the same influence on portfolio outcomes; at the worst of times, asset allocation almost completely determines success or failure. And yet, most investors embrace policy portfolios which explicitly limit deviations from strategic, long-term asset allocation targets. These same institutions then turn around and take large and regular active bets within each asset allocation sleeve by trading stocks, bonds, and managers. To our eye, these investors approach the problem exactly backwards.
The Policy Portfolio Paradigm
It has long been considered prudent investment policy to separate the asset allocation decision from the active investments in portfolios. Typically, asset allocation is expressed as a semi-permanent policy or reference portfolio guided by an advisor, a board, and/or an investment committee. In many cases, this policy allocation is loosely based on intermediate or long-term estimates of risk premia and covariances across the eligible asset universe. Once the policy portfolio weights are struck, the investment staff set about selecting managers within each of the asset class silos with the goal of harvesting alpha from security selection.
This process is motivated by the perception that the opportunity to generate incremental excess returns is much higher in the security selection space than the asset allocation space. After all, Grinold showed how investment fortune favours market breadth, and there are vastly more securities (i.e. stocks and bonds) than there are asset classes (i.e. stock and bond market indexes, commodities, REITs, etc.) to choose from. This (mis)perception informs the relative priority placed on the pursuit of alpha from active security selection relative to active shifts in asset allocation.
Market inefficiencies exist for a variety of reasons, such as asymmetric information, tax frictions, and emotional biases. Perhaps the most economically significant inefficiencies stem from structural constraints imposed on a large segment of investors. We view the structural bias in favour of security selection versus tactical asset allocation among institutional and private investors as an important example of this type of inefficiency. As such, so long as tactical asset allocation is largely ignored by most investors, active asset allocation represents one of the most economically important sources of excess returns available to investors in public markets.
Shoulders of Giants
Most previous studies on the impact of asset allocation relative to security selection have been performed on pension funds and mutual funds, and explore the degree to which total portfolio variance is explained by deviations from institutions’ long-term policy portfolios. The studies are structured as attribution analyses, where portfolio returns are disaggregated into returns due to the policy portfolio and active returns, which in most studies are defined as the residual not accounted for by the policy portfolio.
Brinson et al. (1986, 1991) regressed monthly portfolio total returns for pension funds against the monthly returns to each fund’s policy portfolio, and determined that the policy portfolio explains approximately 90% of the monthly variance in total returns. Many citations of Brinson’s original publications in this field falsely suggest that their analysis makes conclusions about return attribution. However, Brinson’s study mainly proved that once an institution sets a strategic asset allocation, it tends to stick to it wtih minimal deviation through time.
Ibbotson & Kaplan (2000) recognized the omnipresence of misperception around Brinson’s analyses and set out to correct this in their paper, “Does Asset Allocation Policy Explain 40, 90, or 100% of Performance?” Aside from validating Brinson’s original analysis, they answered two related questions: to what degree does asset allocation explain the variability of performance between different investors, and; to what degree does asset allocation explain the level of long-term performance?
To determine how well asset allocation explained the dispersion in returns across funds, the authors performed a cross sectional regression of returns from funds and institutions against respective policy benchmarks. They determined that 40% of the difference in returns across funds is explained by differences in asset allocation policy, with the balance determined by some combination of tactical shifts, sector bets, security selection, and fees. Notably, their analysis did not yield attributions among the remaining variables, so one is left to guess at their relative importance.
Lastly, Ibbotson and Kaplan performed an attribution analysis to determine the percent of long-term absolute performance explained by a fund’s asset allocation. They calculated the long-term performance of each fund’s policy portfolio and compared it against actual long-term fund returns. The results of this analysis are described in Table 2.
Table 2.
![begin{tabular}{|l|r|r|} hline Study & Average % & Median % \ hline Brinson 1986 & 112 & --\ Brinson 1991 & 101 & --\ Ibbotson 2000 [Mutual Funds] & 104 & 100\ Ibbotson 2000 [Pension Funds] & 99 & 99\ hline hline end{tabular}](https://gestaltu.com/wp-content/ql-cache/quicklatex.com-4c813abbb24111c36b3140ef19bc2f86_l3.svg)
Ibbotson and Kaplan stated that, on average, asset allocation explained 99% and 104% of long-term returns. How might we interpret this finding? Recall that the total return to portfolios were decomposed into the total return to the fund’s policy portfolio using asset class benchmarks, plus the active return, minus trading frictions. So the results of this study demonstrate that, over the periods studied in the analyses, the average institution lost 4% of total return to fees, ineffective active management, or poor manager selection.
Combined with the original analysis by Brinson, which makes the strong case that institutions make very few material deviations from policy weights over time, one is left to conclude that the vast majority of the dispersion and performance decay observed by Ibbotson and Kaplan was due to fees and poor active security selection. This is a troubling condemnation of traditional forms of active management in general.
A step in the right direction
Since institutions apparently do not make meaningful active bets in asset allocation, we are left to ponder how much opportunity was squandered by ignoring this segment of the decision tree. In other words, to what degree can active asset allocation move the needle on portfolio outcomes relative to active security selection?
Fortunately, Assoe et al. [ALP] performed an analysis, modeled after Kritzman and Page (2003), which applied a creative approach to answer this question. ALP used a normative framework, in which the potential returns in each quarterly period from 1985 – 2005 were explored for a large set of constrained, randomly generated portfolios constructed from either asset class indexes, or individual securities.
In the analysis by ALP, benchmark weights were assigned for a theoretical fund that included cash (5%), bonds (30%), stocks (40%), real estate (10%), private equity (10%), and commodities (5%). This broadly reflects the composition of a typical U.S. endowment, or family office policy portfolio, though ALP focused on U.S. asset classes only, which substantially limits the breadth of the asset class portfolio. You will see why this is important later in this series, but for now the ALP analysis is one step forward.
At the start of each annual period, 100 draws were made from the asset pool, where the probability of drawing an asset class at each draw is in proportion to the neutral policy weights above. Each draw represented 1% of the final portfolio for that year, so 100 draws comprised a fully invested portfolio of varying composition. The returns to these random portfolios were then computed for each quarter of the subsequent year, after which a new random portfolio was constructed in the same way. This process was repeated 10,000 times each year for the 20 year period from 1985 through 2005.
The purpose of this procedure was to generate a large sample of random portfolios produced exclusively from marginal changes to asset allocation around prescribed weights. To this end, the dispersion of portfolio returns is due exclusively to changes in asset allocation, as opposed to the other variables cited by Ibbotson and Kaplan.
A similar procedure was then used to generate stock portfolios from a long-term S&P 500 stock dataset. In this case stock portfolios were created at the start of each year by randomly selecting 100 stocks. The probability of inclusion at each random draw for any given stock was equal to the stock’s current weight in the index, so that over many trials the average weight for each stock would converge to the stocks’ market cap weighting, though each single random portfolio would deviate normally around these value. This procedure was also repeated 10,000 times over the entire 20-year investment period, with each repetition representing one sample portfolio.
Figure 2.
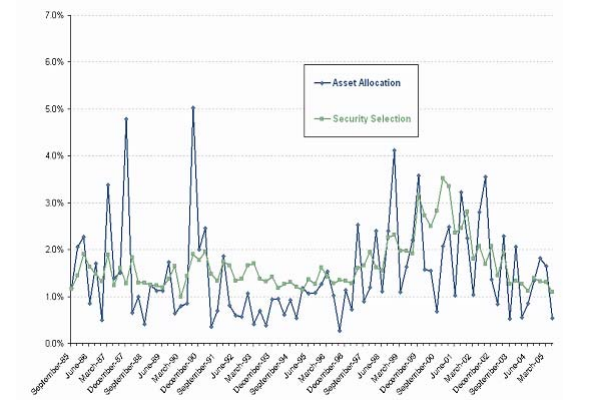
Source: Assoé, L’Ehr and Plant (2006)
ALP were concerned with measuring the dispersion in returns between top performing random portfolios and worst performing random portfolios over time. This dispersion would serve as a proxy for the breadth of opportunity available for a manager to out- or under-perform. They measured dispersion by calculating the performance difference between the 5th and 95th percentile portfolios in each quarter for both the asset allocation portfolios, and the stock selection portfolios. The authors asserted that this dispersion (see Figure 2.) proxied the true empirical breadth of bets available within each asset universe at each period. They documented three important conclusions:
- The relative importance of asset allocation and security selection is time-dependent.
- The asset allocation driven dispersion is more volatile than the security selection induced dispersion.
- The security selection activity generates as much dispersion in active return as asset allocation, so that it cannot be unequivocally declared that one activity is structurally more or less important than the other.
We would add a few other observations. First, the paper deliberately constrains the deviations in allocations to the six asset classes by setting average weights in the asset pool according to a typical institutional weighting scheme. While this assumption is consistent with the current decision-making latitude of many institutions, it substantially understates the true breadth of independent bets that might be available from an unconstrained asset allocation decision. Second, while the the authors do note that the relative breadth available from asset allocation and security selection varies profoundly through time (Figure 2), they offer little in the way of discussion about how or why this time variation is observed. Third, as noted above ALP constrained the study to U.S. asset classes and stocks, which substantially attenuates the available breadth across the liquid asset class universe. We will address each of these points later in this article series.
Conclusion
Most investors miss the forest for the trees by focusing on security selection rather than asset allocation to produce better portfolio outcomes. As a case study, we showed how the best stock pickers in international stock markets could not hope to compete with even the worst stock pickers in domestic U.S. markets over the past five years. Rather, outcomes in equity portfolios were almost completely dominated by geographic effects; individual securities played a much smaller role.
Brinson, and later Ibbotson and Kaplan, demonstrated that for a large universe of institutional investors, asset allocation explained over 90% of quarterly portfolio returns. This research mostly served to prove that the aggregate of active asset class bets and active security bets had very little impact on portfolio outcomes. However, there are several possible reasons why this might be the case. Perhaps institutions rarely deviate from policy asset class weights. Alternatively, perhaps active security bets across managers mostly cancel each other out, resulting in only minor active security risk. In any event, these seminal authors left the work of sorting out asset class vs. security selection effects to future researchers.
Assoé, L’Ehr and Plant rose to the challenge with a creative random portfolio simulation modelled on a typical endowment portfolio’s asset allocation. Under rather severe constraints, they observed that asset allocation and security selection play equally important roles in long-term portfolio outcomes. They also noted that the impact of asset allocation and security bets on portfolio outcomes varies profoundly over time. However, they did not elaborate on why this might be the case.
In our next article, we will provide a compelling theoretical argument for why asset allocation decisions should dominate long-term portfolio outcomes. We will combine concepts from each of our prior articles to make our case, and show how relative contributions from asset allocation and security selection are sensitive to various correlation assumptions. In the end you will see that, even during the most favourable periods for security selection, asset allocation explains over half of total universe breadth. In less favourable stock-picking environments, asset allocation almost completely determines the success or failure of a portfolio.
Note: This series expands on the concepts discussed in our whitepaper, Tactical Alpha: A Quantitative Case for Active Asset Allocation. If you would like to skip ahead by reading the original paper, you can download it here.
See also:
Tactical Alpha in Theory and Practice Part I