The S&P 500 Hot Hand Fallacy
by Ben Carlson, A Wealth of Common Sense
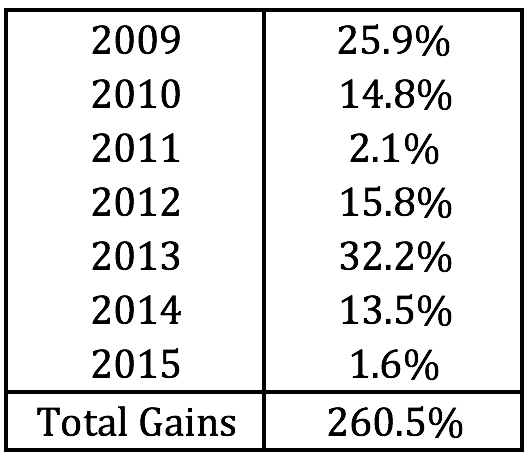
It may not seem like it to some, but stocks — as measured by the S&P 500 — are up six years in a row. They’re slightly positive through the end of last week too, so if those meager gains hold through the rest of calendar year 2015, that would mark seven consecutive years of gains, as you can see here:
Obviously, the year isn’t over yet and the year-to-date gain in the S&P could be wiped out in a single day, but a number of investors are calling for a down year in stocks simply because they haven’t had one in a while. I looked back at the historical track record to see how rare it is for this kind of streak to occur. You don’t have to go back too far to see such a string of gains as stocks had two major runs in the 1980s and 1990s. Here’s the first one that marked the beginning of a long bull market in 1982:
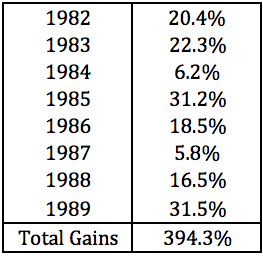
This eight year streak didn’t go out with a bang as much as a whimper. In 1990 the S&P was down -3.1%. Then the following nine years this happened:
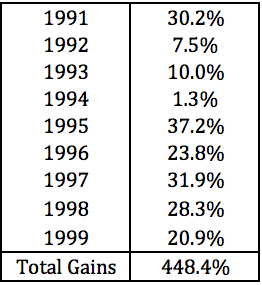
This is the longest streak of consecutive gains that I could find in U.S. stocks. Finally, in the year 2000 stocks fell just over 9%, starting a streak in the opposite direction as stocks fell for three straight years in the aftermath of the dot-com bubble.
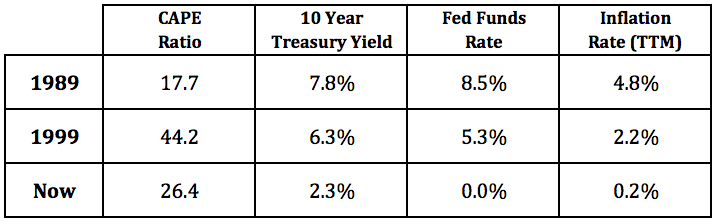
Some assume it’s very easy to compare different market environments to look for clues as to when stocks are going to top out again. As you can see from this comparison, it’s not quite that easy to make blanket statements across cycles as every time is always different:
Playing the probabilities would lead you to believe that it would make sense for this year or next year to finish out with negative returns in large cap U.S. stocks. It’s certainly a possibility and it will happen eventually. But the markets don’t always make sense or play by the rules.
It’s pretty crazy when you consider that there was just one down year in the stock market from 1982-1999, an eighteen year window. In fact, going back to 1982, there have been just five down years in the S&P 500. That’s 5 out of 33 or just 15% of the time. Taking the data back to the 1920s has shown that stocks have been up roughly 3 out of every 4 years. While the 1982-1999 bull market was extraordinary in its duration and magnitude, it’s not like it was easy to stay invested the entire time.
In the 1980s streak, stocks had an average intra-year drawdown of -12%. In the 1990s run, the average drawdown was -9%. The average intra-year drawdown in stocks since 2009 comes in at -10% each year. Here’s the visualization of these stats from JP Morgan:
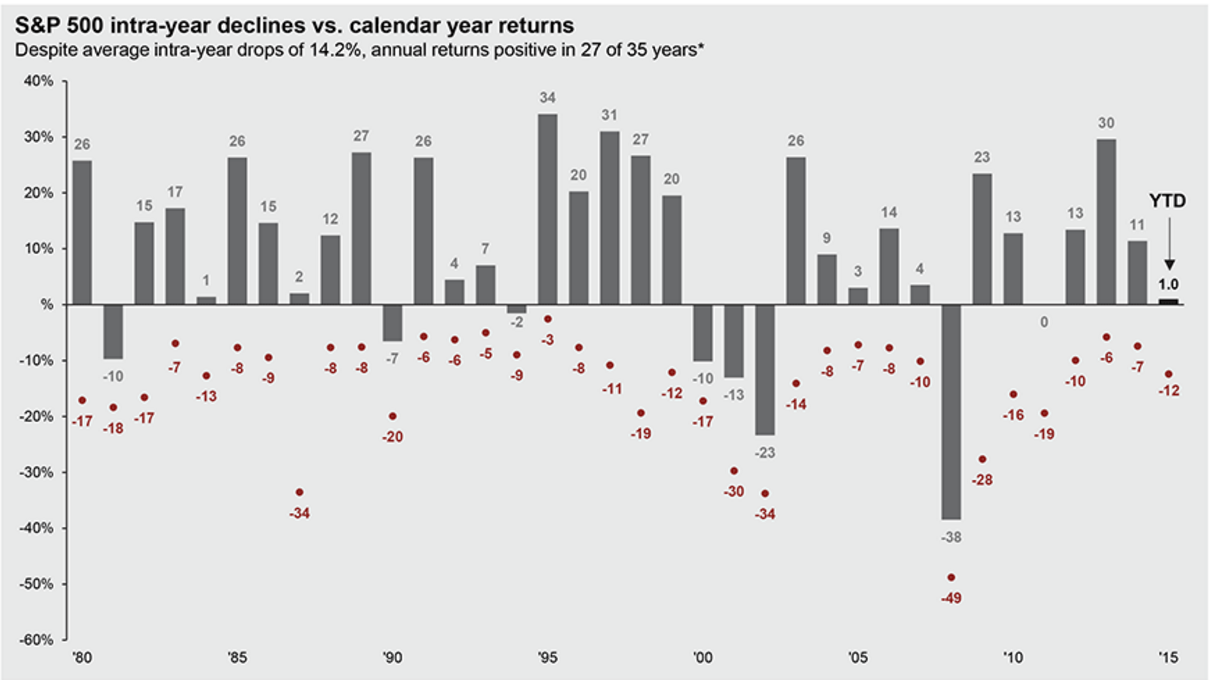
Stocks finished the year up 2% in 2011, yet they fell 19% at one point during the year. In 1987, stocks finished the year up slightly, but endured a 34% crash along the way.
Investors probably place too much emphasis on month-end, quarter-end and year-end time frames when judging themselves or the markets in terms of performance. These are really just arbitrary periods that we’ve all agreed to pay attention to because it makes it easier to compartmentalize things.
Does it really matter if stocks finish this year up 1% or down 1%? It shouldn’t, but us humans aren’t the most rational bunch. For some reason (loss aversion) a small loss will sting much more than a small gain will feel good. These types of streaks are interesting, but in the grand scheme of things, don’t really matter all that much.
Further Reading:
Would a Repeat of the 1987 Crash Really Be That Bad?