Using Random Portfolios To Test Asset Allocation Strategies
by James Picerno, Capital Spectator
Last month I tested random rebalancing strategies based on dates and found that searching for optimal points through time to reset asset allocation may not be terribly productive after all. Let’s continue to probe this line of analysis by reviewing the results of randomly changing asset weights for testing rebalancing strategies.
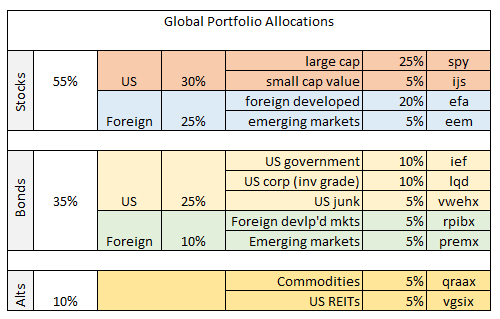
I’ll use the same 11-fund portfolio that’s globally diversified across key asset classes with a starting date of Dec. 31, 2003. The benchmark strategy is simply rebalancing the portfolio at the end of each year back to the initial weights, as defined in the table below.
Let’s assume that the benchmark strategy is someone’s best effort at portfolio design. Our fictional investor—let’s call him Ronald–has thought long and hard about asset allocation and decided that the portfolio mix above is the way to go. Ronald has back-tested the strategy with actual data with the funds listed above and thinks that the results are encouraging. A $100 investment at the start date (Dec. 31, 2003) increased to just over $200 as of Oct. 2, 2015. Ronald concludes that the portfolio’s 100% cumulative gain over the sample period is pretty good. He pats himself on the back and goes out for a celebratory dinner, confident that he’s built a winning portfolio. In other words, Ronald’s convinced that he possesses a fair amount of skill in the art/science of building and managing portfolios through time.
While Ronald’s away at the Overconfidence Café, let’s analyze his portfolio design by comparing it with random portfolios. We’ll use the same funds in the table above but randomly vary the weights for each of the portfolio’s assets. To ensure a fair test, we’ll keep the random weights within the same range in the table above—a minimum of 5% up to a maximum of 25%. Using R (you can find the code here), we’ll create 1,000 portfolios, each with a randomly selected mix of different weights for the 11 funds. To match Ronald’s portfolio, the strategies are 1) rebalanced back to the randomly selected target weights at the end of each year; 2) are always invested in each fund in some degree; 3) but no shorting or leverage is allowed. In sum, the random portfolios are identical to Ronald’s strategy with one exception: the asset weights are allowed to wander within a 5%-to-25% range.
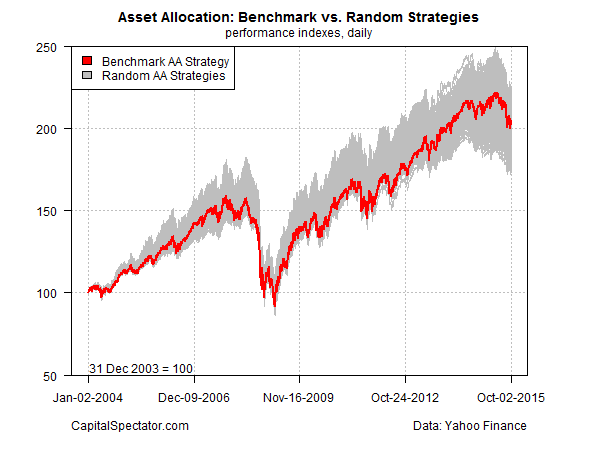
The chart below compares Ronald’s strategy (red line) with the 1,000 portfolios that randomly vary the asset weights (gray area). As you can see, Ronald’s portfolio results are more or less average relative to the randomly generated results. The implication: Ronald’s skill may be a figment of his imagination, courtesy of looking at one return sample, namely, the portfolio he designed and back-tested.

For another perspective, let’s compare the ending value–204–of Ronald’s benchmark portfolio for the sample period with the distribution of ending values for the 1,000 randomly generated strategies (black line). I’ve also added the median outcome for the random portfolios (blue line).
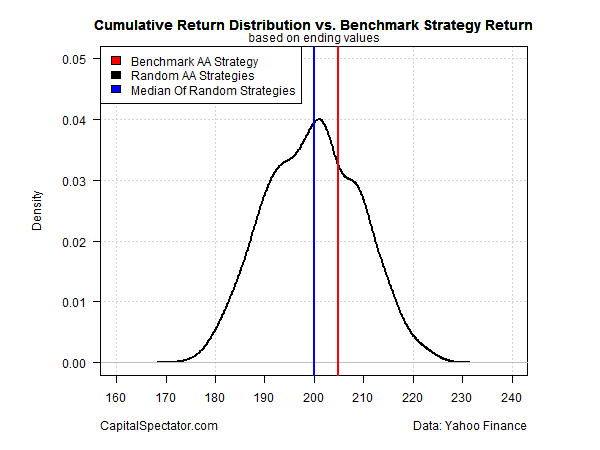
The good news for Ronald’s ego is that his portfolio earned a slightly above-median return. Is that evidence of skill? Maybe, but we’d have to run additional tests for a deeper level of confidence before crowning Ronald as an asset allocation wizard.
For instance, we could review the drawdown history of Ronald’s portfolio and compare it with the randomly generated strategies. Analyzing the portfolio’s Sharpe ratio, Sortino ratio and other risk metrics in context with the random results is a productive line of inquiry as well. The question is whether Ronald’s portfolio takes on substantially more risk than is necessary to earn what appears to be a middling performance?
The larger point is that by creating 1,000 random portfolios we have a robust data set for analyzing risk and skill. The toy example above can easily be expanded to generate a more nuanced set of random portfolios, offering a more realistic array of investment possibilities. What if we expanded the range of weights to, say, zero up to 50% for any one fund? How would the results change if we added a momentum filter for choosing weights for each fund? We could also impose a volatility limit. The possibilities are endless. Ideally, the testing would be customized to match the investor’s risk tolerance, goals, and other factors that are unique to a given strategy under the microscope.
The key lesson is that using a set of random portfolios to evaluate a given strategy is a powerful tool. By comparison, the standard approach—comparing a portfolio to one idealized benchmark or a peer group in the same strategy neighborhood—is inferior as a methodology for analysis. Why? Because cherry picking a handful of funds for a benchmark isn’t representative of what could happen. If we’re testing a portfolio strategy, it’s essential to review all the possible outcomes, even if those outcomes never occurred in the real world.
Granted, random portfolios aren’t a crystal ball—the future’s still uncertain. But if you’re analyzing investment strategies without the benefit of random portfolios, you’re overlooking a lot of valuable insight–insight that may spare you grief later on. Maybe someone should tell Ronald.