Squiggly line cartoons
by Andrew Adams, CMT, Raymond James
In last Thursday’s Morning Tack, Jeff Saut referenced an opinion piece on MarketWatch that was essentially the literary equivalent of someone shooing away a stray dog. The author scoffed at the recent Dow Theory sell signal and laid out several reasons why he believed it to be wrong in this case. And I have no problem with that; we have, after all, also decided to ignore it for now because of the extreme circumstances it took to provide such a signal. However, what does burn me more than the sun down here in Florida is that the commentary begins with the lines below:
“Here’s my definition of technical analysis (TA), the dubious belief that squiggly lines on a chart will predict price moves. While some signals work sometimes, generally TA is just cartoons for investors who can’t be bothered with fundamental analysis. Like most cartoons, technical analysis is entertaining but not much help.”
As a card-carrying technical analyst (the Market Technicians Association did actually give me a card!), “thems be fightin’ words.” Though I can’t really fault the author too much; a negative opinion of technical analysis is, alas, still a common occurrence here in this business, as many just don’t get it or don’t see any benefit to putting thought into where the price of something is or has been. I, obviously, disagree, but I guess that if some investors can make it work without using technical analysis, I should actually be impressed. I don’t think I could do it, having to rely solely on ever-changing fundamentals that are frequently estimated and heavily revised. Instead, I strongly believe that a combination of fundamental and technical analysis is necessary to truly have any chance of figuring out where the markets or stocks themselves are headed. In the long-term, assets do move based on their fundamentals, but a quick glance at the charts can really help confirm when you are right in your thinking, or at least give you some warning that you may be wrong or that things are about to turn. And someone out there is obviously watching the technicals at the moment, as the S&P 500 has pretty much played it exactly by the book and bounced from one key level to another over the last several weeks.
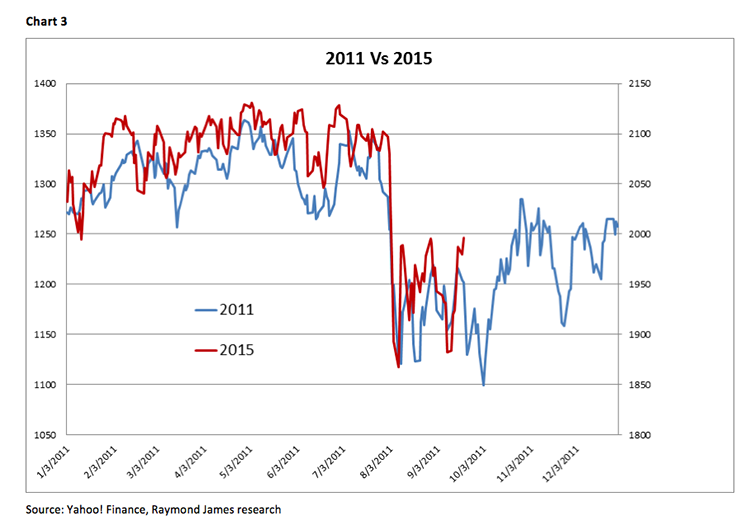
We have written frequently about the probable “W” or “double-bottom” pattern that this market appears to be in the process of making, and we have mentioned how bottoms themselves are processes and often take time to form. So far, our words are being corroborated by the action taking place in the S&P 500, as the index is forming an almost picture-perfect “W” and is on a nice little run that includes higher closes in eight of the last nine sessions (Chart 1 on page 3). That bounce sprang up from the lows of the pattern around 1867, so we are obviously not the only ones that believe that to be the market’s primary “line in the sand.” It’s amazing what squiggly line cartoons can do when enough people are paying attention to them! But those same technicals are now telling me that it may be a bit tougher for the market to head much higher here without some sort of pause. Friday’s intraday movement took us right back up to an area of dual selling pressure created by the 2020 high from September and the 100-day exponential moving average at 2021, and this resistance level proved too strong for the index on its first attempt to break through. The 200-day exponential moving average also sits not too far above at 2030 and then the lows from March and July come into play around 2040-2045, so there is quite a bit standing in the way of further gains in the short-term. And, unfortunately, a pullback here would be consistent not only with historical seasonality (Chart 2), but would also be in-line with the 2011 analog model we presented in our Gleanings publication from Friday (Chart 3). It’s really amazing how well 2015 has synced up with 2011, and if that correlation continues we will likely see a period of weakness here over the next couple of weeks before rallying into year-end. I believe that to be the most probable scenario, but, of course, anything can happen, so we continue to watch closely.
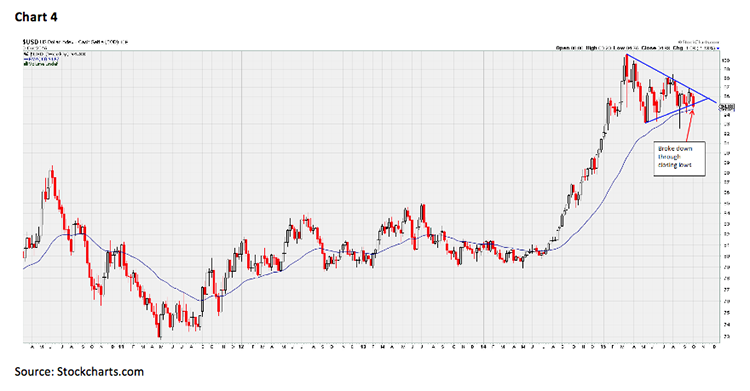
I am optimistic, though, that we can possibly end the year on a high note and set us up nicely for 2016, and a few developments last week helped bolster that optimism. For one thing, crude oil had its biggest weekly rise in more than six years (per Reuters), with WTI briefly shooting back up above $50. Now, I don’t necessarily want oil prices to rise too high or too fast, but more stable (and profitable) levels would definitely help an energy sector that was a major drag on stock market performance over the last year. And many of these companies have benefitted from the recent rally in both oil and stocks, with energy sector funds jumping upwards of 17% since late September. Also, the US Dollar Index has played its part by weakening over the last few months, taking some of the pressure off of corporate earnings and threatening to break down through some important technical support levels (Chart 4). Tom Lee, from Fundstrat, even said in a note from last week that “based on the current trajectory, one-third of this [FX] drag will reverse in early 2016, meaning USD goes from being a headwind to a tailwind.” Considering currency risks and energy underperformance were two of the largest issues weighing stocks down this year, I think it bodes quite well if they are no longer major concerns in 2016.
And, finally, I received a few questions about the Zweig Breadth Thrust that Jeff mentioned in Friday’s Tack, so I wanted to explain a bit more about what this means exactly and why it’s a promising development. First, though, I’ll take a quick second to recommend Marty Zweig’s fantastic book, Winning on Wall Street, which, despite advertising “updated investment strategies for the 1990s!” on the cover of the copy I own, is still one of my favorite investment books out of the dozens I have read. Zweig was, perhaps, best known for calling the 1987 stock market crash the Friday before it occurred, but he was also one of the best at combining fundamental and technical analysis into a rational market opinion. One indicator he is credited with creating is referred to as a “breadth thrust” and, while rare, it is historically a very good sign when it appears. The signal is generated when the 10-day exponential moving average of the percentage of Up Issues rises above 61.5% after being below 40% within the last two weeks. Now, I understand that’s getting very technical (pardon the pun), so in case your eyes glazed over while reading that last sentence, all you really need to know is that it’s a sign that quite a few more stocks are now rising than they were a few weeks ago, a sharp reversal that doesn’t happen very often. In fact, according to Rob Hanna at QuantifiableEdges.com, this is only the eighth time the thrust has occurred since 1970, and each of the seven times before, the S&P 500 was higher by at least 3% 20 days later and only once did the market pull back more than 2.5% during those next 20 days. So that does offer some optimism for the near-term despite our thinking that it may be time for another pullback.
The call for this week: While many critics still view technical analysis as something tantamount to voodoo and consider it nothing more than just squiggly lines, it seems to be doing a fairly good job of showing us the key levels this market is honoring, and, until these prices break, the range may mean more sideways volatility is in order during the next couple of weeks. 2020 and 1867 are the areas to watch, respectively, on the upside and downside, and violations of these on a closing basis could indicate where the market most likely wants to go. There are a few hurdles just above the S&P 500 right now and negative seasonality might make it even tougher for stocks to break through this resistance on the first attempt, but overall I am still cautiously optimistic that we are being set up nicely for an attempt at higher prices going into the end of the year. So keep your shopping lists close by (our Analysts’ Current Favorites are a good place to start), because if we do get a pullback here, I believe it’s going to be for buying as long as 1867 continues to hold. In the meantime, I continue to watch my entertaining cartoons.


Copyright © Jeffrey Saut, Raymond James