


SIA Weekly: What defines a significant, unfavourable change in downside risk e.g. Valeant Pharma
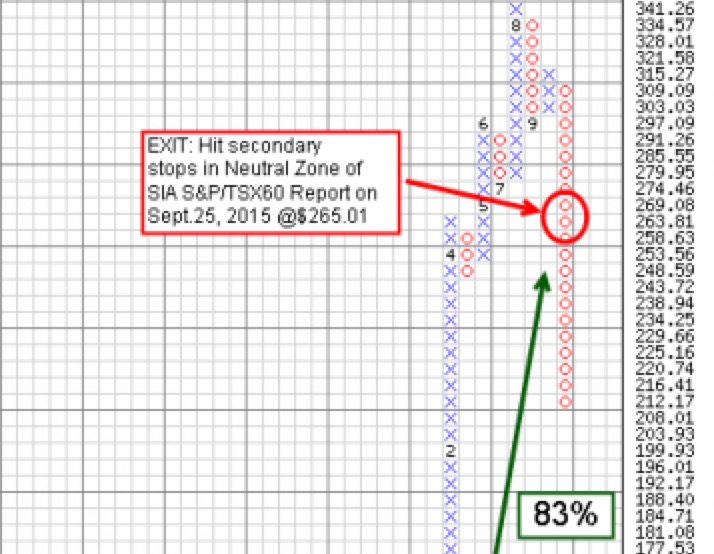
For this week's Equity Leaders Weekly, we will examine the trading history of one of Canada's strongest large cap stocks over the past 5 years using our Relative Strength Methodology. Valeant Pharmaceuticals Intl recently hit our secondary stops after a strong run in the Favoured Zone of the SIA S&P/TSX60 Report, so we thought a look back at how our relative strength rankings fared in capturing the huge uptrend in this stock since 2010 would be useful.
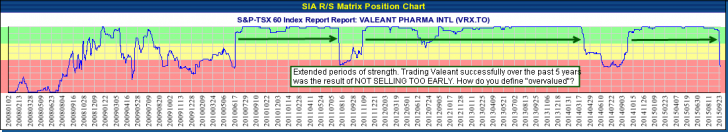
Valeant Pharmaceuticals Intl (VRX.TO)
In our opinion, one of the biggest obstacles to successful investing is how investors define "risk"? We are not just talking about volatility here, but the idea that a stock is "too high" or "overvalued" or "overbought". We hear these terms being talked about all the time by analysts as they warn us about the risks of staying in a certain stock because it has risen too much? First of all, no matter what metrics you use to define when something has risen too much, ultimately it is their best guess and nothing more! The market will always have the final word on when a stock's rise will end. But the million dollar question is how do you define a significant change in trend direction that aligns with the market? Just because a stock has risen 50%, or reached its new 52 week highs, or looks overbought from a technical perspective doesn't mean its longer term trend is ending. The amount of money left on the table using these subjective metrics is substantial! Successful investing not only requires a disciplined approach to buying and selling, but also knowing when to hold on and not sell too early!
We define risk from a relative strength perspective, meaning that when the longer term price action of a stock falls "relative" to its peer group, this is indicating that the supply/demand relationship of that stock is becoming more unfavourable and therefore its risk is increasing. Supply/Demand is ultimately driven by "money flows" so the relative price action of stocks is actually the markets footprints on where money is flowing! This is key because you cannot analyze anything in isolation, it must be analyzed as part of the whole in order to get a true perspective on what is happening in the markets. Falling stock prices don't mean anything by itself, but falling prices "relative" to all other stocks means that money is flowing out of that stock relative to everything else and therefore this becomes an objective indicator that shows changing supply/demand characteristics for that stock. Hitting 52 week highs doesn't mean the stock is more risky as long as it is still showing more favourable supply/demand characteristics than the rest of the market. This is how we define "risk" that actually aligns itself with a holistic perspective of the markets!
Click on Image to Enlarge
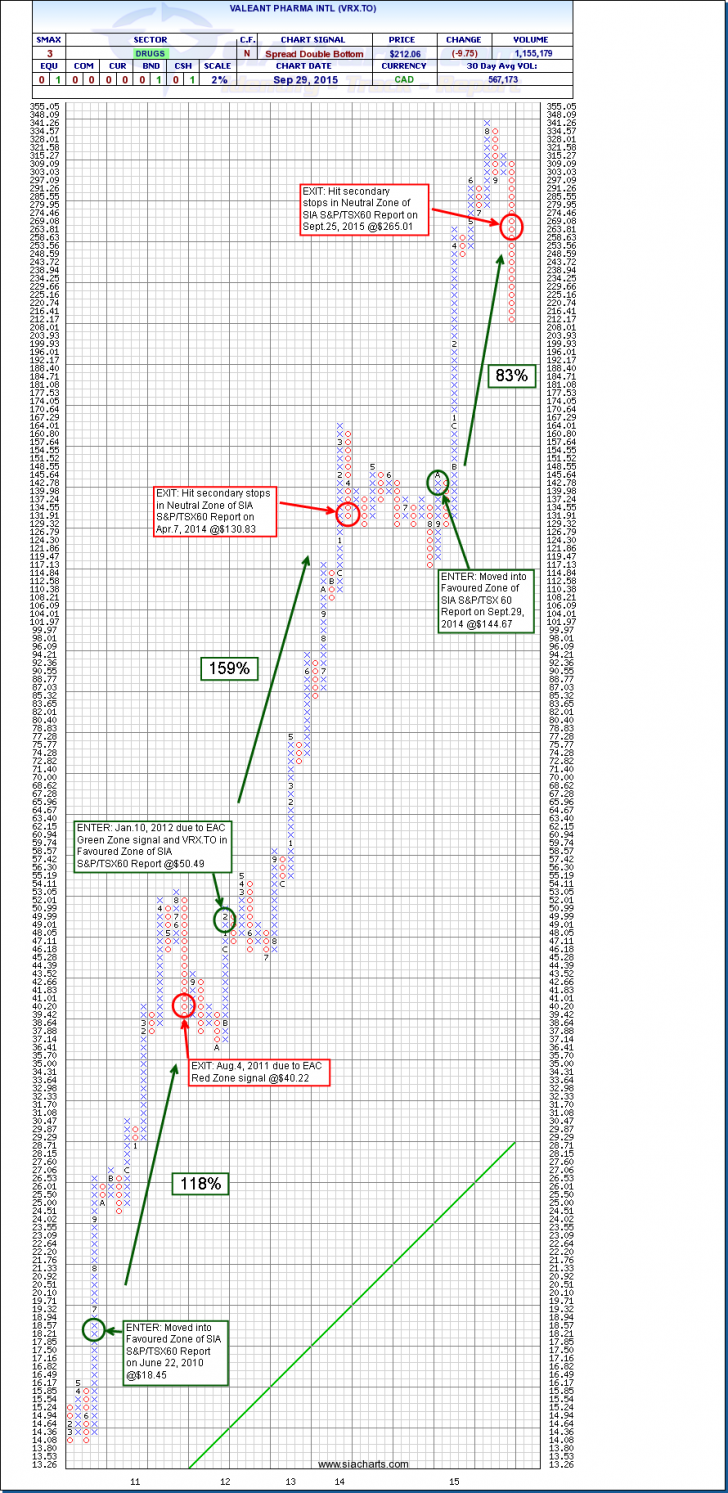
Valeant Pharmaceuticals Intl (VRX.TO) PnF Chart
In our opinion, one of the biggest misconceptions about investing is that you have to buy low and sell high to be successful. The problem with this strategy is actually defining "what is low and what is high?". Many investors get caught trying to buy a stock that has fallen in value or has reached so-called "oversold" levels in hopes that they are catching the bottom. Then if they were lucky enough to be right on this trade will then sell their position after it has gone up 40% because it is getting too high? What happens in this scenario is that they gamble on picking the bottoms then sell too early in its uptrend because they think it is too risky?
Our approach doesn't try to catch the bottoms, this is the higher risk scenario because in order for a stock to drop significantly its supply is exceeding demand. And just when you think the selling is over, there is a new leg down and you are stuck with a falling stock. Instead we buy strength, sell weakness. What this does is prevent us from trying to "catch a falling knife" and guess at the bottom. We move into a stock if it is showing more favourable supply/demand characteristics than its peer group and STAY INVESTED as long as it continues to show strength. This enables us to capture more of the uptrend and prevent us from selling too early thereby potentially leaving huge profits on the table. This approach will therefore forego some return at the beginning of a strong move and give some back at the end, but its focus is to try and capture the fat part of the uptrend and avoid the fat part of the downtrend. Looking at our example of how his worked with Valeant, we can see 3 major uptrends occurred using our Relative Strength system over the past 5 years. We simply used the SIA S&P/TSX60 Report and the Equity Action Call overlay to indicate possible buys and sells. The returns for these 3 uptrends were as follows: +118%, +159% and +83%. Not catching the bottoms of these uptrends didn't affect our ability to generate huge returns with this stock because we were able to stay invested in Valeant for longer than many would have been comfortable with using their subjective indicators for defining risk.
Click on Image to Enlarge
SIACharts.com specifically represents that it does not give investment advice or advocate the purchase or sale of any security or investment. None of the information contained in this website or document constitutes an offer to sell or the solicitation of an offer to buy any security or other investment or an offer to provide investment services of any kind. Neither SIACharts.com (FundCharts Inc.) nor its third party content providers shall be liable for any errors, inaccuracies or delays in content, or for any actions taken in reliance thereon.
For any questions on this article, please call or email us at 1-877-668-1332 or siateam@siacharts.com.< em>
Copyright © SIACharts.com