
Dip Buyers are Gamblers
by Michael Harris, Price Action Lab
During high volatility periods and especially near major tops and bottoms there are opportunities for dip buyers. The gains are random and those who think they were able to predict them usually return them back to the market if they continue this pattern of trading. A backtest also offers an example of why paying too much attention to Sharpe ratios can be hazardous to your portfolio.
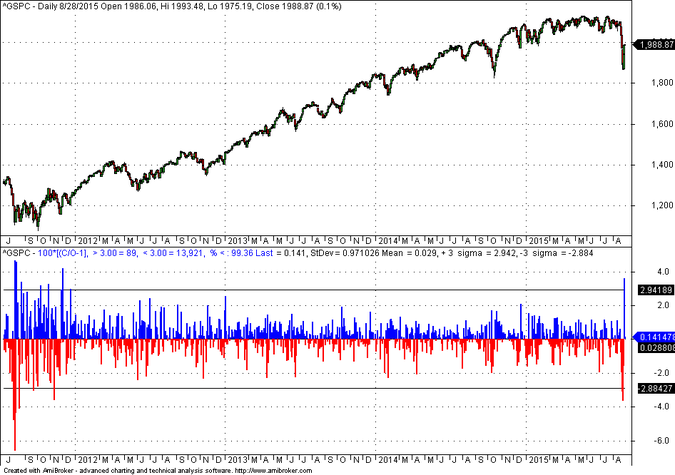
Last week we heard many in the social media bragging about their gains after having bought the dips in many stocks or ETFs. The S&P 500 gained 3.62% from its open on Wednesday, as it may be seen on the indicator pane of the chart below:

Then the index rose an additional 2.4% on Thursday. The 3.62% gain from the open on Wednesday was higher than the three standard deviation band of open to close returns at 2.942%.
However, the dip buyers should understand that they were lucky and nothing in their actions can be attributed to an ability of forecasting correctly price direction. Actually, they gambled because often large gains on an open to close basis are followed by large losses. This happened during the 2011 correction as shown on the next chart.
Volatility clusters and large gains to the upside may be followed by large losses to the downside. We will backtest the following system in SPY with data from inception to 08/28/2015:
Condition: change from high of 6 days ago to low of yesterday < -11%
Buy the next open if condition is true
exit after 3 days at the close
The equity performance of this trivial system with a 3-day exit is shown below (in general I do not recommend time-based exits but this is just an example that reflects recent speculator behavior.)
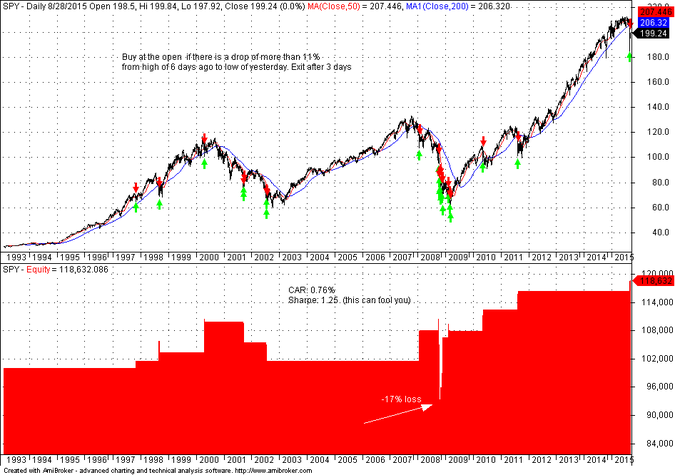
The CAR is +0.76% on a sample of 21 trades. Sharpe is 1.25. Now, this can fool some quants that pay too much attention to the Sharpe ratio. Notice that the 1.25 Sharpe includes a trade during the 2008 crash with a loss of -17%. I am certain that none of the speculators from 2008 were part of the group that bought the recent dip for a random profit.
Actually, my quantitative analysis that is part of my premium service generated two long signals in Dow-30 stocks at the close of Friday, August 21, 2014 for KO and CVX, based on weekly data, as shown below:
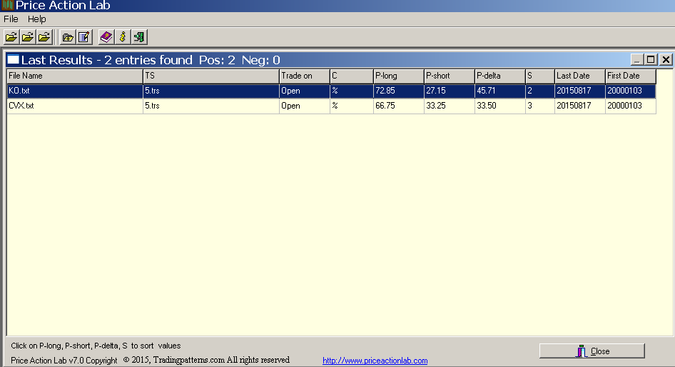
(Last date of 20150821 is for the weekly bar for the week of Monday, August 21, 2015).
CVX rose 14% and KO rose 3.85%, both from the open of Monday, August 24, 2015. However, I do not label these successful forecasts because most stocks registered large gains during last week.
You can subscribe here to notifications of new posts by email.
Charting program: Amibroker
Disclaimer
Detailed technical and quantitative analysis of Dow-30 stocks and popular ETFs can be found in our Weekly Premium Report.
© 2015 Michael Harris. All Rights Reserved. We grant a revocable permission to create a hyperlink to this blog subject to certain terms and conditions. Any unauthorized copy, reproduction, distribution, publication, display, modification, or transmission of any part of this blog is strictly prohibited without prior written permission.