
12 Questions for a 12 Percent Correction
KEY TAKEAWAYS
· This week we answer the top 12 investor questions in response to the S&P 500’s 12% correction.
· We expect the U.S. economic expansion and bull market may continue through year-end, despite the latest stock market correction and
China uncertainty.
· We reiterate our forecast for stocks to produce mid- to high-single-digit returns in 2015.
by Burt White, CIO, LPL Financial
The recent market downdraft and related uncertainty in China have led to many investor questions. The strong 6.5% rebound in the S&P 500 over the last three trading sessions (August 26, 27, 28, 2015) has cut the S&P 500’s losses from the 2015 peak (2130 on May 21, 2015) to 6.7%. In response to the S&P 500’s recent 12% correction — the first decline of more than 10% since 2011 — we answer 12 investor questions. Bottom line, we do not expect the latest correction and China uncertainty to lead to the end of the U.S. economic expansion or the end of the six-and-a-half-year old bull market. We reiterate our forecast for stocks to produce mid- to high-single-digit returns in 2015* on improving earnings over the second half of 2015 and into 2016.
*Historically since WWII, the average annual gain on stocks has been 7 – 9%. Thus, our forecast is in-line with average stock market growth. We forecast a 5 – 9% gain, including dividends, for U.S. stocks in 2015 as measured by the S&P 500. This gain is derived from mid-single-digit earnings per share (EPS) gains for S&P 500 companies. Earnings gains are supported by our expectation of improved global economic growth and stable profit margins in 2015.
12 QUESTIONS
1. Will the slowdown in the Chinese economy send the U.S. economy into recession? We do not think so, especially given our belief that China will continue to add stimulus, both monetary and fiscal, to shore up its economy and markets. The indicators that we watch — in particular the Leading Economic Index (LEI) discussed in the recent Weekly Economic Commentary, “Forecast for Clear Skies” — continue to point solidly toward U.S. economic expansion for at least the next 12–18 months, and we believe the next recession may be a good bit further out than that. (U.S. gross domestic product [GDP] grew 3.7% during the second quarter of 2015 and is on track to grow about 2.5% in the third quarter.)
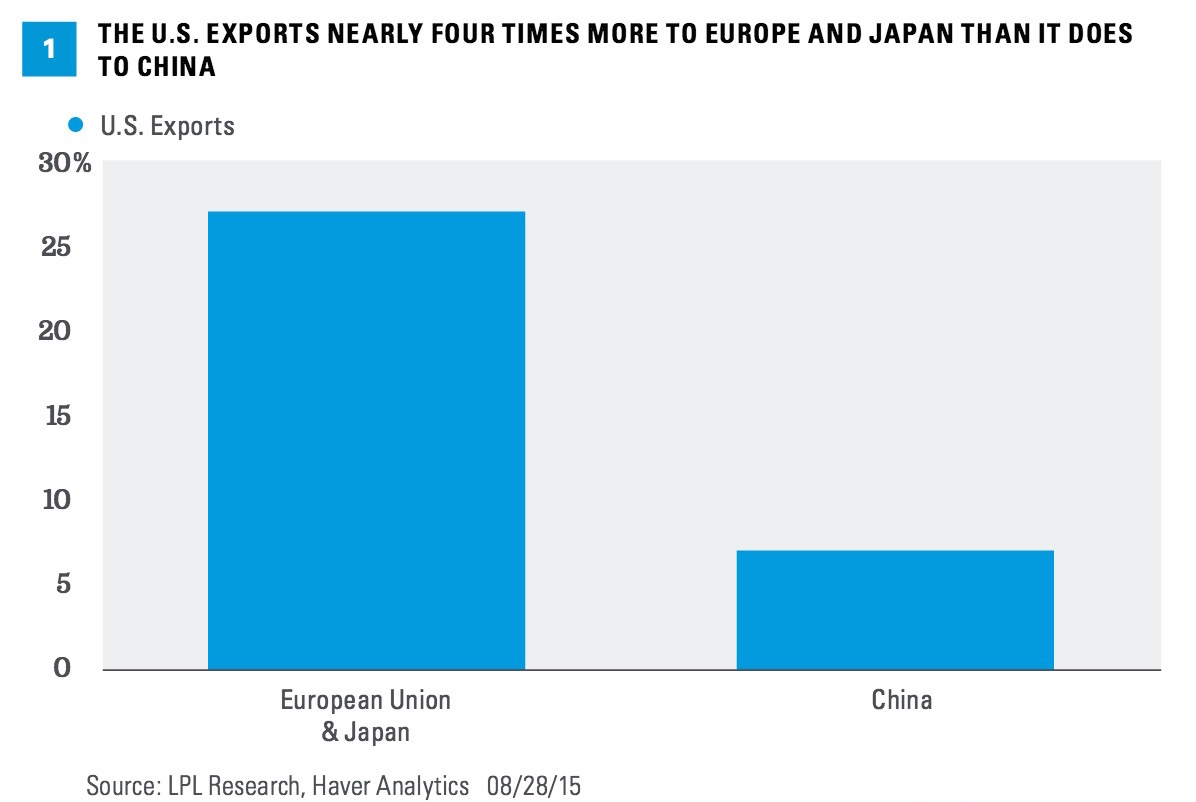
Putting China into economic perspective, the country is the destination for only about 7% of U.S. exports, about one-fourth the amount that goes to Europe and Japan [Figure 1], which means that the Chinese economy directly represents less than 1% of U.S. GDP. As a result, the overall impact on U.S. corporate profits from slower growth in China is likely to be limited (outside of the commodity-linked sectors). A weaker yuan may even result in cost savings for U.S. multinationals sourcing supplies in China. (China devalued its currency on August 11, 2015.)
2. Will the latest stock market correction lead to the end of the bull market? We do not think so. Bear markets are almost always accompanied by recession, which we do not expect for quite some time. We do not see evidence of the excesses in the U.S. economy or financial markets (e.g., in terms of leverage, confidence, or spending) that have historically led to bear markets and recessions. We do not believe the slowdown we are seeing in China’s economy is enough to outweigh improving growth in the U.S., Europe, and Japan in 2015 and 2016, and we expect global growth to continue to improve gradually over the next 18 months.
3. Are you sticking with your 5 – 9% total return forecast for the S&P 500 in 2015? Yes. We continue to expect improved U.S. economic growth and second half earnings gains to propel stocks to mid- to high-single-digit total returns in 2015. Other possible factors we expect to be supportive: 1) better growth in Europe and Japan (along with the potential for more stimulus), 2) low interest rates that make bonds relatively less attractive than stocks, 3) a Federal Reserve (Fed) that may keep rates “lower for longer,” 4) low but stable oil prices, 5) historically strong fourth quarter seasonality, and 6) price-to-earnings multiples that have fallen to long-term average levels.
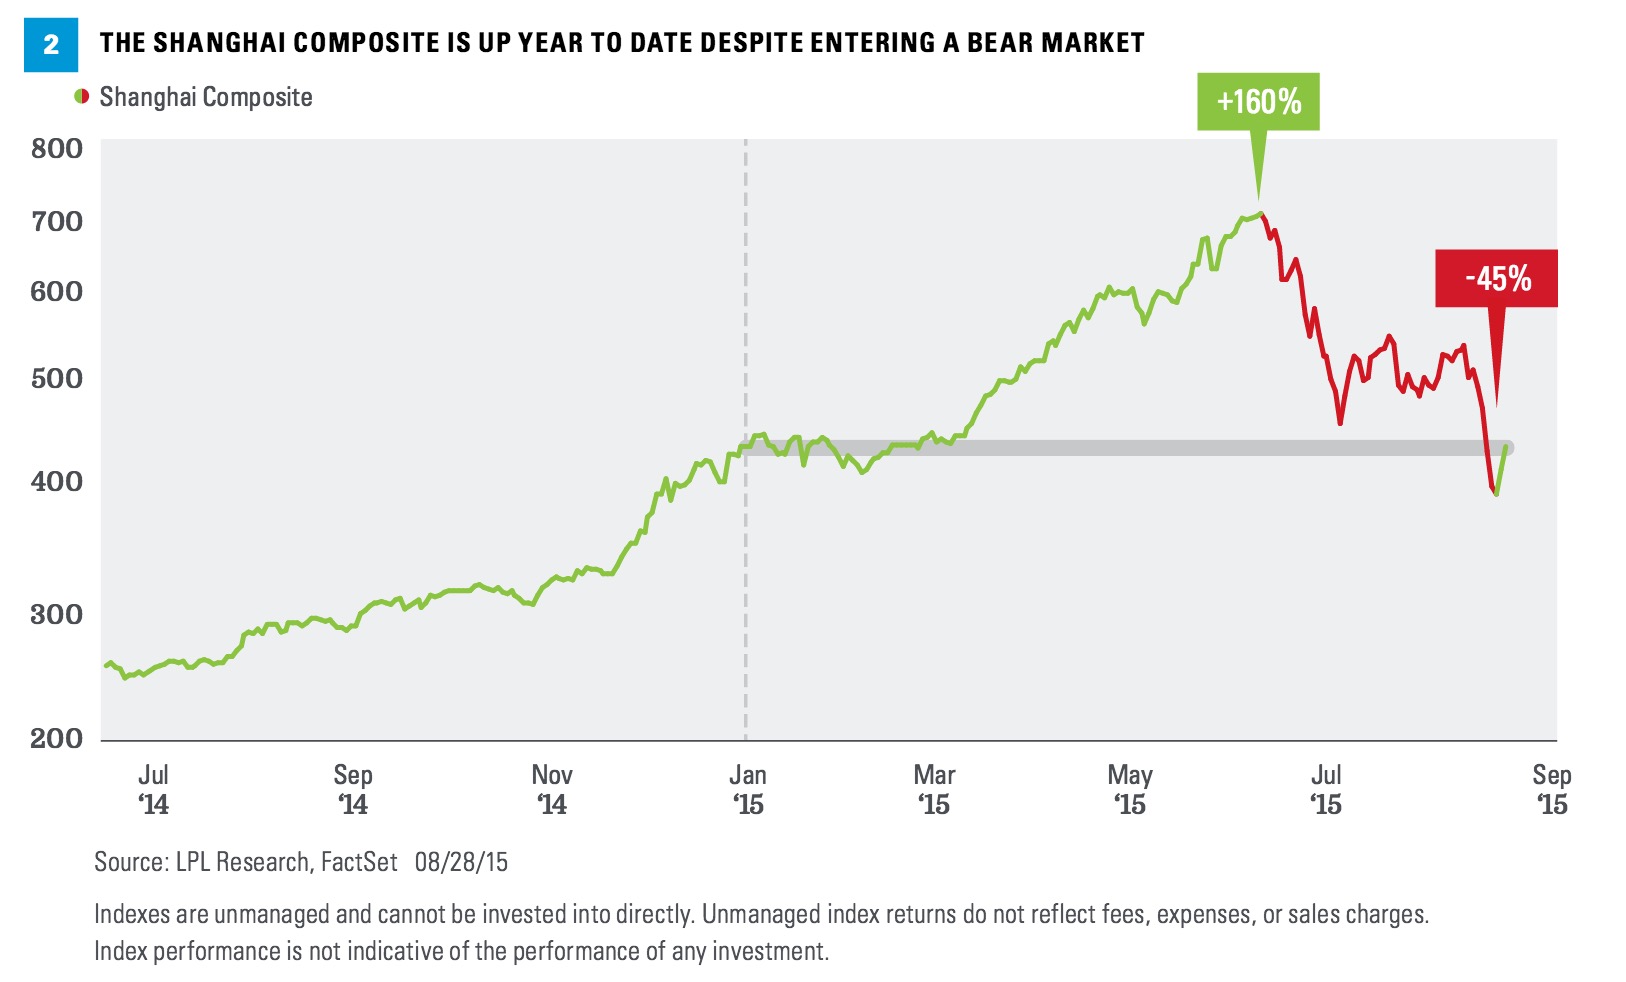
4. Do you expect China to do more to stimulate its economy and markets? Yes. But the bigger question is: Will it work? Efforts thus far have been met with mixed success; however, we expect the Chinese government to do more, including fiscal stimulus, to help stabilize its economy and markets, and we believe it will eventually be successful. Three things to keep in mind: 1) the Chinese stock market is disconnected from the Chinese and global economy; 2) stimulus works with a lag; and 3) the Shanghai Composite A-share market (mainland Chinese stock market) is actually up year to date, despite dropping more than 40% from mid-June through late August [Figure 2]. The index rose about 160% in the 12 months leading up to the bear market decline that began June 15, 2015.
5. Will China’s currency be devalued further and, if so, what might the impact be? China will likely again widen its currency trading band, which will effectively be a devaluation given the peg to the U.S.dollar is keeping the Chinese currency artificially strong. We would expect additional moves to be gradual and have limited impact on the U.S. given the small amount of U.S. exports to China. The move has the benefit of lowering costs for U.S. companies sourcing goods in China and may help support U.S. company profit margins. The biggest impact may be on other Asian nations competing with China in trade.
6. Besides more China stimulus, what potential fundamental catalysts do you see that could help stocks continue last week’s turnaround? U.S. economic data for August to be released in September (Institute for Supply Management [ISM] Purchasing Managers’ Index on September 1 and the jobs report on September 4), the start of third quarter earnings season (late September), and the upcoming Fed meeting (September 17) are among potential market catalysts. In addition, more stimulus from central banks in Europe and Japan remains a possibility.
7. Does this latest bout of market volatility change the Fed’s timetable for interest rate hikes? Perhaps. We had previously expected the Fed to begin raising rates in December 2015, with September a possibility. We now think September may be off the table and early 2016 may be a possibility. More importantly, the trajectory of future hikes is likely to be gradual. Regardless of when the first hike arrives, we continue to see the Fed as a very manageable risk for stocks this year.
8. What are some attractive buying opportunities resulting from the latest declines? With most everything “on sale,” we increasingly like what we have liked best all year — U.S. large cap growth stocks. At the sector level, that means technology, industrials, consumer discretionary, and biotech, which we would expect to outperform should stocks move higher over the balance of 2015. We also continue to like high-yield bonds on the fixed income side, where we see value amid energy sector default fears.
 9. Should I sell my emerging market equities positions due to Chinese weakness? For suitable investors, we suggest holding on to modest emerging market equities positions due to the long-term value in the asset class. Although it may take some time for that value to be realized, we expect additional bold stimulus from China, eventual (hopefully fairly soon) stabilization in commodity prices, and the export boost from weaker currencies to help spur the next move higher in emerging markets, particularly in Asia.
10. Is 1998 a good comparison to 2015? In some respects, yes. That year, not unlike today, an Asian currency crisis drove sharp losses overseas and contributed to the S&P 500 being down year to date at the end of August. The index rallied sharply during the last four months of that year to end 1998 with a stellar 27% gain. We are certainly not suggesting we’ll get a rally like that (a series of Fed rate cuts in late 1998 is one major difference between then and now, in addition to burgeoning internet mania). But we do believe U.S. stocks have the potential to stage a rally and end the year with respectable gains, despite China’s currency devaluation and its increased economic significance.
11. What technical indicators are you watching to indicate stocks have bottomed? The 14-day Relative Strength Index (RSI-14), a technical momentum indicator that compares the magnitude of recent gains with recent losses in an attempt to determine overbought and oversold conditions, has reached severe oversold levels [Figure 3], increasing the likelihood of a short-term bottom (below 30 is considered oversold). In order to confirm a short-term bottoming process, we are looking for a series of higher highs and higher lows on both the price and the RSI(14), strengthening breadth (broad participation), and high-volume positive sessions. To identify a reversal of the latest downtrend, we are watching for the S&P 500 to sustain a close back above its 50- and 200-day moving averages and a daily RSI(14) reading above 50.
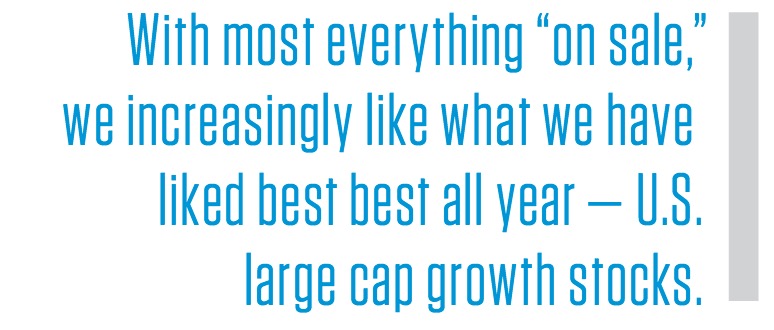
12. Is negative investor sentiment signaling a buying opportunity? The American Association of Individual Investors (AAII) bull/bear survey currently shows a very low percentage of bulls, with a four-week average of 28.5% [Figure 4].
At more than one standard deviation below the long-term average reading of 40%, this smaller percentage of bulls, corresponding to a high level of pessimism, has historically indicated a potential contrarian buying opportunity. For comparison, even during the financial crisis in 2008 – 2009, the percentage of bulls bottomed at about 20%.
Copyright © LPL Financial