


Days of Yesteryear
by Jeffrey Saut, Chief Investment Strategist, Raymond James
“Return with us now to those thrilling days of yesteryear. From out of the past come the thundering hoof-beats of the great horse Silver. A fiery horse with the speed of light, a cloud of dust and a hearty ‘Hi-Yo Silver’ the Lone Ranger rides again” . . . except in this case we are not referring to the iconic radio/TV show, The Long Ranger as played by Clayton Moore, but last October. I awoke early on October 15, 2014, looking for more news on what had caused the 18 session bone-crushing decline. Indeed, after tagging the new all-time intraday high of 2019.26 on September 19, 2014, the S&P 500 (SPX/1970.89) began to slide. That slide started docilely enough with the SPX off a mere ~2.5% on its October 8th close. But, in the last five days of the rout, the SPX plunged another ~148 points to an intraday low of 1820.66 on October 15th for an intraday top to intraday low correction of some 9.84%. There were talks of Dow Theory “sell signals,” Hindenburg Omens, stock market crashes, Iran, Iraq, etc. and fear was rampant. It was on that day (October 15, 2014) Andrew Adams and I did a special strategy call at 4:15 in the afternoon. The message that day was:
Folks, if you didn’t raise some cash like we suggested last summer, you DO NOT raise cash here. This is how bottoms are made. The internals of the equity markets have been weakening since July with many of the indices’ components off more than 20%, while a few of the larger capitalization stocks have been able to keep the overall indexes only marginally lower. Verily, the troops have declined while the generals have held up, but now the generals are retreating. This is how declines end, unless the markets are going to crash. Historically, at market bottoms, the stocks that have tended to hold up finally succumb to the downside creating a panic plunge that is for buying. All investment books tell you the time to buy stocks is when they are out of favor. Regrettably, those same books don’t tell you how to summon the courage to buy stocks when things look so bleak. The quid pro quo is that it is nearly impossible to get investors to sell when stocks are zooming higher and times are ebullient. Amazingly, this is the only product I know of that when they put the product on sale, nobody wants to buy it!
To be sure, “return with us now to those thrilling days of yesteryear” because what is currently happening on Wall Street is almost an exact replay of last October. To wit, the internals of the equity markets have been deteriorating for months. Andrew and I have repeatedly written about this. As previously stated (paraphrased from the astute Day Hagan money management firm whose risk-adjusted mutual fund I own):
The U.S. equity markets continue to evidence deterioration beneath the surface. For example, based on the largest 4000 publicly traded companies on U.S. exchanges, more than 45% of those companies, or 1,804 of them, are 20% or more below their 3-year highs. Furthermore, 24.09% of those 4000 companies are 40% or more below their respective 3-year highs (we use 3-year highs to eliminate misleading short-term spikes that could skew results).
Accordingly, we have been writing that what has been happening is the “troops” have been retreating while the “generals” have been hanging in there, creating the illusion things were okay. Last week, especially the last three sessions, those generals began retreating, which spilled over into the “pornographic plunge” I spoke of on CNBC last Friday. Quizzed about what that means, I quoted the response from Supreme Court Justice Potter Stewart about pornography, “You will know it when you see it!”

And, that is exactly what we got on Friday, a “pornographic plunge.” Said plunge left the SPX at the lower end of the 1970 – 2000 support level we have described as what we would ideally like to see that index travel into for a potential bottom. It is also worth noting our timing models had targeted August 13 – 18th, with a +/- 3 sessions margin of error, as where to look for a stock market low. Those are the same models that suggested in early July the equity markets were going into a period of “contraction.” That said, in last Friday’s Morning Tack, titled “Capitulation,” I wrote:
And yes, I think we are bottoming. It might happen today. The only caveat I would offer is one of my mantras, “Never on a Friday,” meaning when markets get into one of these selling squalls they rarely bottom on a Friday, giving investors the weekend to brood about their losses. Subsequently, they show up the next week in “sell mode,” which often leads to “Turning Tuesday.”
Also of note is that once the markets get into one of these selling-stampedes, they tend to last 17 – 25 sessions (last October’s was 18 sessions), with only 1 – 3 sessions pauses/rally attempts, before they exhaust themselves on the downside. It is just the rhythm of the thing in that it seems to take that long to get everyone bearish enough to throw in the towel and capitulate. Today (last Friday) would be session 24, which might also be exacerbated by the option expiration.
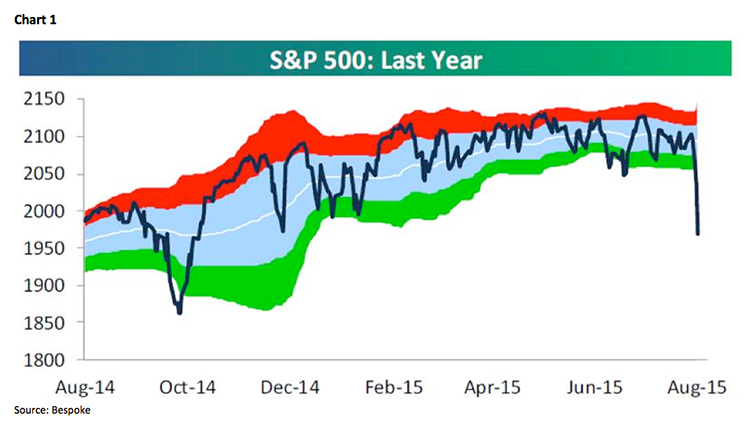
Of course, last week’s pounding, like last October’s decline, was accompanied with worries about China, GDP, ISIS, war in Korea, interest rates, the Fed, recessions, etc. The result has pressured the SPX down ~7.7% from its May 20th intraday high, while the D-J Industrial Average (INDU/16459.75) has shed ~10.3% from its mid-May highs. So, the Industrials are into correction territory, but the SPX is not. Now the SPX has not experienced a 10% correction in 46 months for the third longest stretch ever. Remember, a less than 5% drop is considered a “pause,” a 5% - 10% slide is termed a “dip,” a 10%+ decline is a “correction,” and a 20%+ plummet is a “bear market.” In Friday’s morning missive I wrote about many of the finger-to-wallet indicators/ratios I monitor that have been stretched to extreme oversold levels (Link to the Full Research Document). On Friday after the close, Bespoke wrote this, “While it was already a weak day on Friday, equities finished at their lows of the day and the week. With that drop the index closed out the week trading 4.4 standard deviations below its 50-DMA, which is the most oversold reading since 10/19/87, which was the day of the crash (see chart 1).” In addition to those points, last week Bespoke wrote (as paraphrased): The last 2 times the VIX was up 10%+ 3 days in a row, the SPX was higher 1 week and 1 month later. In the month following 10/13/14, it jumped almost 9%.
Not to be outdone, the sagacious Jason Goepfert (SentimenTrader) notes:
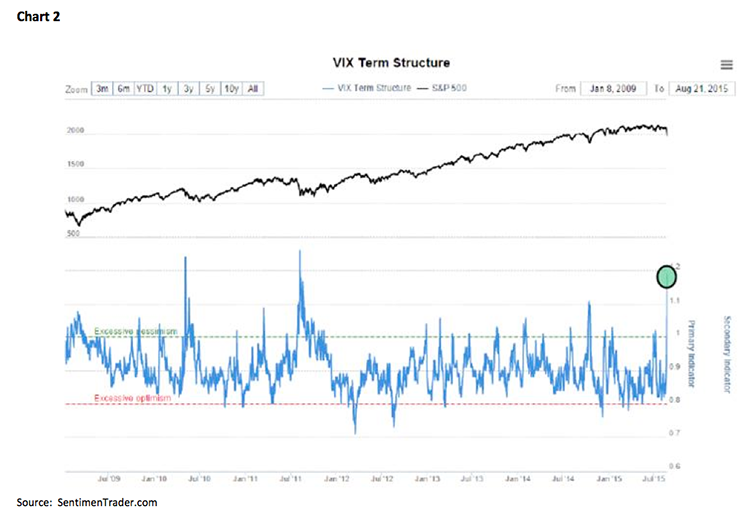
Now I highlight the VIX term structure above because the VIX curve has now become inverted or gone into a state of backwardation, something we only see when markets have entered the panic phase of a correction. Now in plain English all backwardation means is that traders expect heightened volatility in the short term but expect volatility to subside the further out in the future we go. Normally it is the other way around where the markets place a higher premium on volatility the further out in future you go, much like the interest rate curve. Note in the chart how conditions today with the VIX resemble what we saw back in early August of 2011 as we approached a short term low (see chart 2).
So late last week the call went out to our fundamental analysts, “In the midst of the current market dislocation, we are looking for names that have the highest sustainable free cash yields, upper single digit or higher if possible.” Here is the resultant list so far, in no particular order: CACI (CACI/$80.46/Outperform), Cisco (CSCO/$26.47/Outperform), Booz Allen Hamilton (BAH/$26.88/Outperform), CVS (CVS/$102.21/Outperform), Enterprise Products (EPD/$27.33/Strong Buy), Polycom (PLCM/$10.43/Outperform), Republic Services (RSG/$42.00/Strong Buy), and Manhattan Associates (MANH/$59.91/ Outperform).
The call for this week: Last week we told you to get your “buy lists” ready. This week, unless we are into a “crash” (we don’t believe it), we should see some kind of tradeable low. Reinforcing that view is a friend of mine from an era gone by. It was in the early 1970s when John Gaynoe and I worked at the venerable brokerage firm of EF Hutton, which is where I began writing investment strategy in December of 1974. John went on to become a senior portfolio manager at Capital Guardian LLC Wealth Management. Late last week he penned a letter to clients, with whose points I absolutely agree. I am only including the Q&A portion of John’s letter below. This morning, however, the preopening S&P 500 futures are off some 45 points at 5:00 a.m. as China loses 9% overnight and the U.S. dollar swoons. Turning Tuesday, anyone?!
Q&A Below Courtesy of John Gaynoe, Capital Guardian LLC Wealth Management
Q) How significant was the 21 August decline?
A) Not nearly as significant as it may appear. The “Obama Bull” began on the open 10 March 2009 with a rally of 5.65%. This Bull Market has had twenty two moves of 3% or more: ten up moves and yesterday the twelfth move down.Q) Yesterday the market dropped -3.39%. How does that compare to the average DJIN price change in this bull Market?
A) The average daily price change on the DJIN in the Obama Bull has been .94%.Q) Can you put that in context?
A) Yes; the 21 August decline was about 3.6 times the average price change in the DJIN for this Bull Market. The average daily price change has been 125.3 points since March 2009.Q) The average daily price change on the DJIN has been 125.3 points! Are you sure?
A) Yes I’m sure; I was very surprised at this number as well.Q) You often write about what normal looks like. What do these observations mean for the future?
A) Our Valuation model projects a year 2020 target on the DJIN of approximately 29,079. If this target is reached and the volatility remains constant at about .94% average daily price change, the average daily price change on the DJIN over the next five years will be about 214 points.Q) Your 2020 target on the DJIN is over 29,000. What does this assume?
A) The 30 stocks in the DJIN have been valued at 16.5 times earnings over the past years and are expected to earn $6.07 in 2016. The five year growth rate estimate is 9.45% per year. This gives us $8.71 a share in DJIN earnings by 2020. The average DJIN stock closed at $81.31 on 21 August. The 2020 earnings target is $143.73 per share. The ratio of the average stock price to the DJIN currently is 202.32; $143.73 times 202.32 is 29,079. This is not guess work here.Q) Is the DJIN over valued as many “experts” contend?
A) Not at all; the DJIN is currently valued at 13.4 times 2016 earnings whereas the trailing five year average is 16.5 times earnings. Since yearend 2006 the DJIN has been valued at 15.3 times earnings.Q) Based then on the technical evidence, what just happened?
A) The market almost certainly experienced a text-book Selling Climax on 21 August 2015. It is likely this was also a Terminal Shakeout. But this must be proven or disproven by the market action over the next several days.Q) Is the market decline over?
A) Extremely likely but nothing is certain. But the key issue is this: if this was a Selling Climax coupled with a Terminal Shakeout, a yearend target of 20,000 is realistic. We will know in a few days.
Copyright © Jeffrey Saut, Chief Investment Strategist, Raymond James