The financial crisis of 2007 to 2009 highlighted the importance of downside risk management. Many managers that protected capital during this period saw their AUM balloon.
Some of these same managers underperformed in the post-crisis years. This underperformance should be anything but surprising.
We often compare tactically risk-managed strategies to uncertain insurance policies. Investors pay premiums in the form of upside underperformance. The potential payoff occurs if the market crashes.
A consistent bull market lacks the raw material necessary for these managers to outperform. And this in no way erodes the value proposition of risk-managed strategies. After all, homeowners insurance is valuable even if your house doesn't burn down.
In their quest to manage drawdowns, many investors we talk to miss a key element of risk management. They constrain their search to strategies that offer high return relative to downside risk.
Strategies that experience lower drawdowns than the existing portfolio can indeed reduce portfolio drawdown.
Yet, a strategy does not need to exhibit low drawdowns for it to reduce overall portfolio risk. As with many things in life, the whole is often greater than the sum of its parts.
A strategy with high drawdown risk can reduce portfolio drawdown if the losses do not overlap with losses in other assets or strategies held by the investor.
As a simple example, say that an equity portfolio is 100% allocated to the S&P 500 ETF SPY. Over the last ten years, SPY has returned 7.7% with volatility of 21.0%*. The largest peak to trough loss - otherwise known as the max drawdown - over the period was 55.2%.
Now consider a made-up tactical strategy: the Benjamin Button Strategy ("BBS"). The returns for BBS are the same as for SPY, but in reverse order. The first daily return for BBS (8/1/05) is the last daily return for SPY (7/29/15) and vice versa, the second daily return for BBS (8/2/05) is the second to last daily return for SPY (7/28/15), and so on.
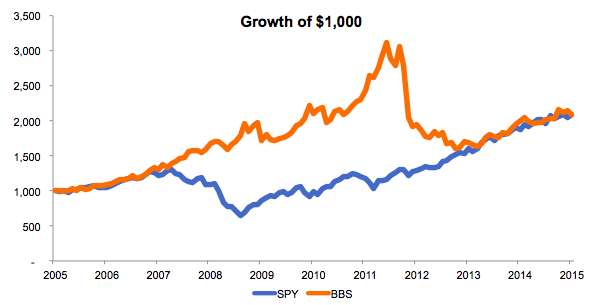
We present the performance of BBS versus SPY for the last ten years below**.
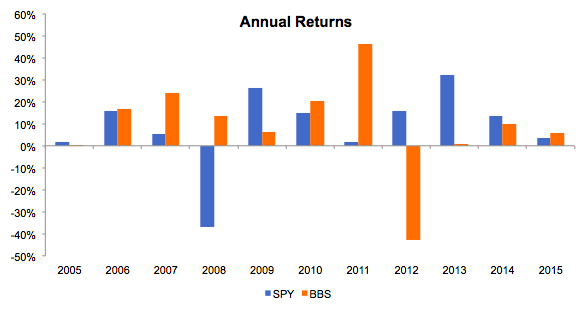
At first blush, this looks like your run-of-the-mill tactical blow up. Assets would have piled into the strategy after strong returns in 2007, 2008, 2010, and 2011. And then assets would have left just as fast after 2012 and 2012. Underperforming SPY by 59% and 31% in consecutive years will do that after all.
BBS's ten year return and volatility are almost identical to SPY. However, the path to get there was very different. BBS spent more time in large drawdowns than SPY since BBS's large loss in 2012 was following by middling performance from 2013 to 2015. In contrast, SPY put up double digit returns in 5 of the 6 years following 2008.
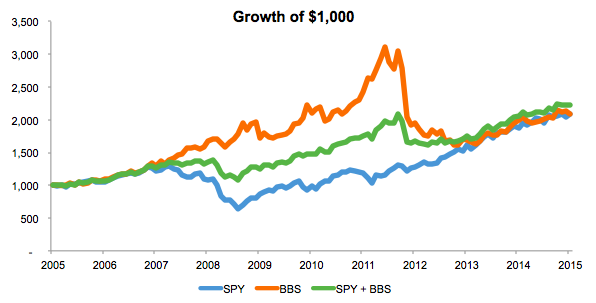
To an investor screening on downside risk management, BBS looks like a dud. Yet when we construct a 50/50 portfolio of BBS and SPY, compared to just holding SPY, max drawdown is magically reduced by more than 50% (from 55.2% to 25.5%).
Sometimes being different can be just as valuable as being good.
Of course, none of this implies that investors should not seek out low drawdown strategies. However, all strategies will inevitably undergo some degree of drawdown***. The key is to identify strategies and asset classes that will tend to experience these drawdowns at different times. Once these strategies are identified, investors must have the fortitude to stick with the strategies even when their diversified behavior inevitably means we have some negative tracking error to common indices like the S&P 500. After all, we are buying them precisely because they are different.
* Computed using daily log returns. Daily returns and standard deviations are annualized and then translated into linear values.
** 2005 is a partial year beginning 7/29/14. 2015 is a partial year ending 7/29/15.
*** What should concern us are drawdowns that occur when a manager strays from their investment process. This type of drawdown calls into questions the entire track record to begin with.


