by Brad McMillan, Commonwealth Financial Network
Back in February, I looked at U.S. market valuations based on several different metrics, concluding that valuations were quite high—at or above the levels that prevailed before major corrections.
This morning, I was reviewing several data points and realized that valuations had evolved even higher in some cases, meaning that it’s time for an update. As I’ve said many times, this isn’t necessarily a sign of trouble, particularly in the short to medium term, but it’s worth keeping an eye on.
Shiller P/E stabilizes
Let’s start with the Shiller price/earnings ratio, which uses current prices and 10-year average earnings. This metric has leveled off since February and remains around where it was in 2006–2007, though well below the levels of 2000.
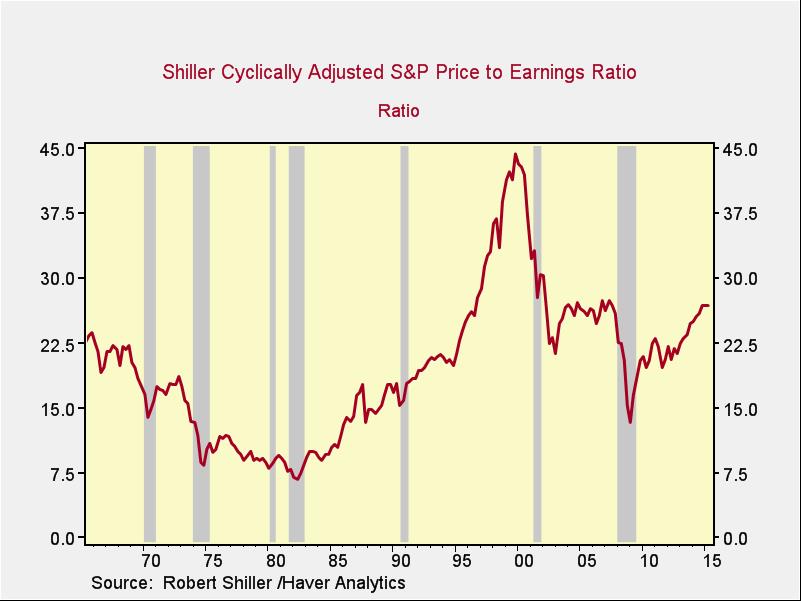
The question going forward is whether valuation levels will continue to increase, which, with earnings growth, would allow higher market returns; remain stable, which would limit market returns to earnings growth levels; or start to pull back, in which case earnings growth still might not drive the market higher.
In any case, future strong market returns now require valuations to move above 2007 levels and closer to the levels of 2000.
Margin debt continues to increase
Any P/E analysis relies on interest rates. Lower rates make a given stream of earnings worth more, and lower rates can justify higher P/Es. In many respects, the high valuation levels of the past couple of decades may have been due to declining rates, and the leveling off of valuations recently may reflect the possibility that rates will start increasing again.
One market valuation metric that isn’t dependent on interest rates is the level of margin debt. Historically, high debt levels have often preceded market trouble in many asset classes—not only stocks but also real estate and, most recently, housing. We can look at the ratio of debt to market capitalization as a reasonable risk measure.
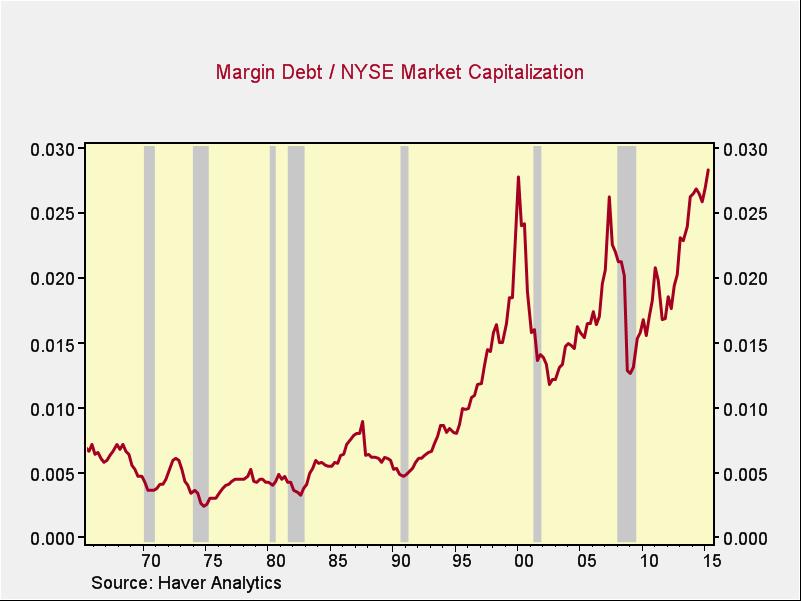
This chart tells us several things:
- Since 1994, margin debt has been higher than it was in 1987. Arguably, this represents a new normal, but it might also be a force that has allowed the market to continue to climb higher.
- After a decline earlier this year to below 2007 levels, the ratio has climbed again to heights above those of 2000. Note that, despite the absolute levels, local peaks (in 1973, 1987, 2000, and 2007) all led in reasonably short order to market pullbacks. The fact that this ratio has jumped to a new peak is a concerning data point.
The Buffett indicator levels off
A final way to evaluate market valuations is to compare them to the economy overall. This is often known as the Warren Buffett indicator, as he is said to favor it. A benefit of this metric is that it's based neither on interest rates nor on debt, but on the country as a whole.
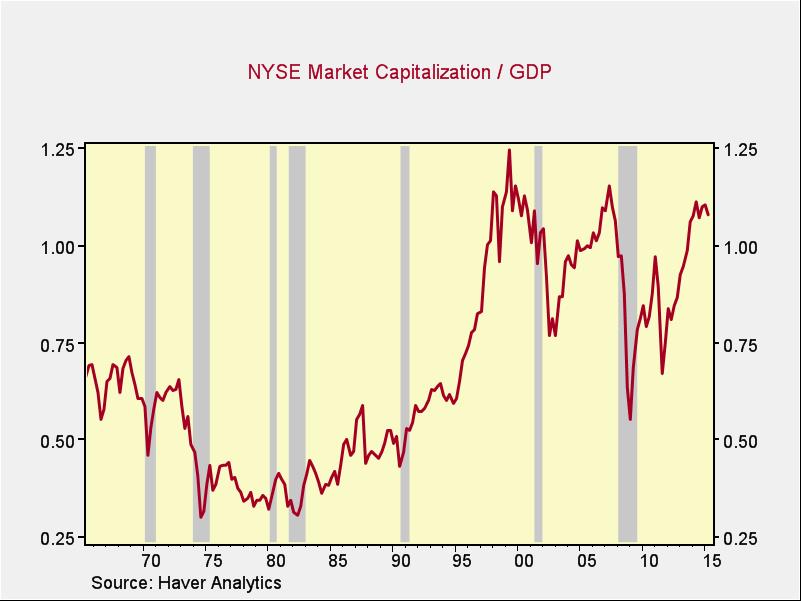
Once again, valuations are at levels above those of any point prior to the late 1990s but have recently leveled off slightly below the 2007 peak and somewhat below the 2000 peak. The conclusions here are similar to those for the Shiller P/E: growth may come, but it will require a move back above 2007 levels and closer to the 2000 high.
Overall, risk on the rise
What we have seen, since February, is that market valuation levels have stabilized for the Shiller P/E and market cap-to-GDP measures. At the same time, debt has continued to increase to levels above those of 2000.
Again, none of this is necessarily an indicator of trouble, but it’s worth noting that risks appear to have increased over the past several months.