
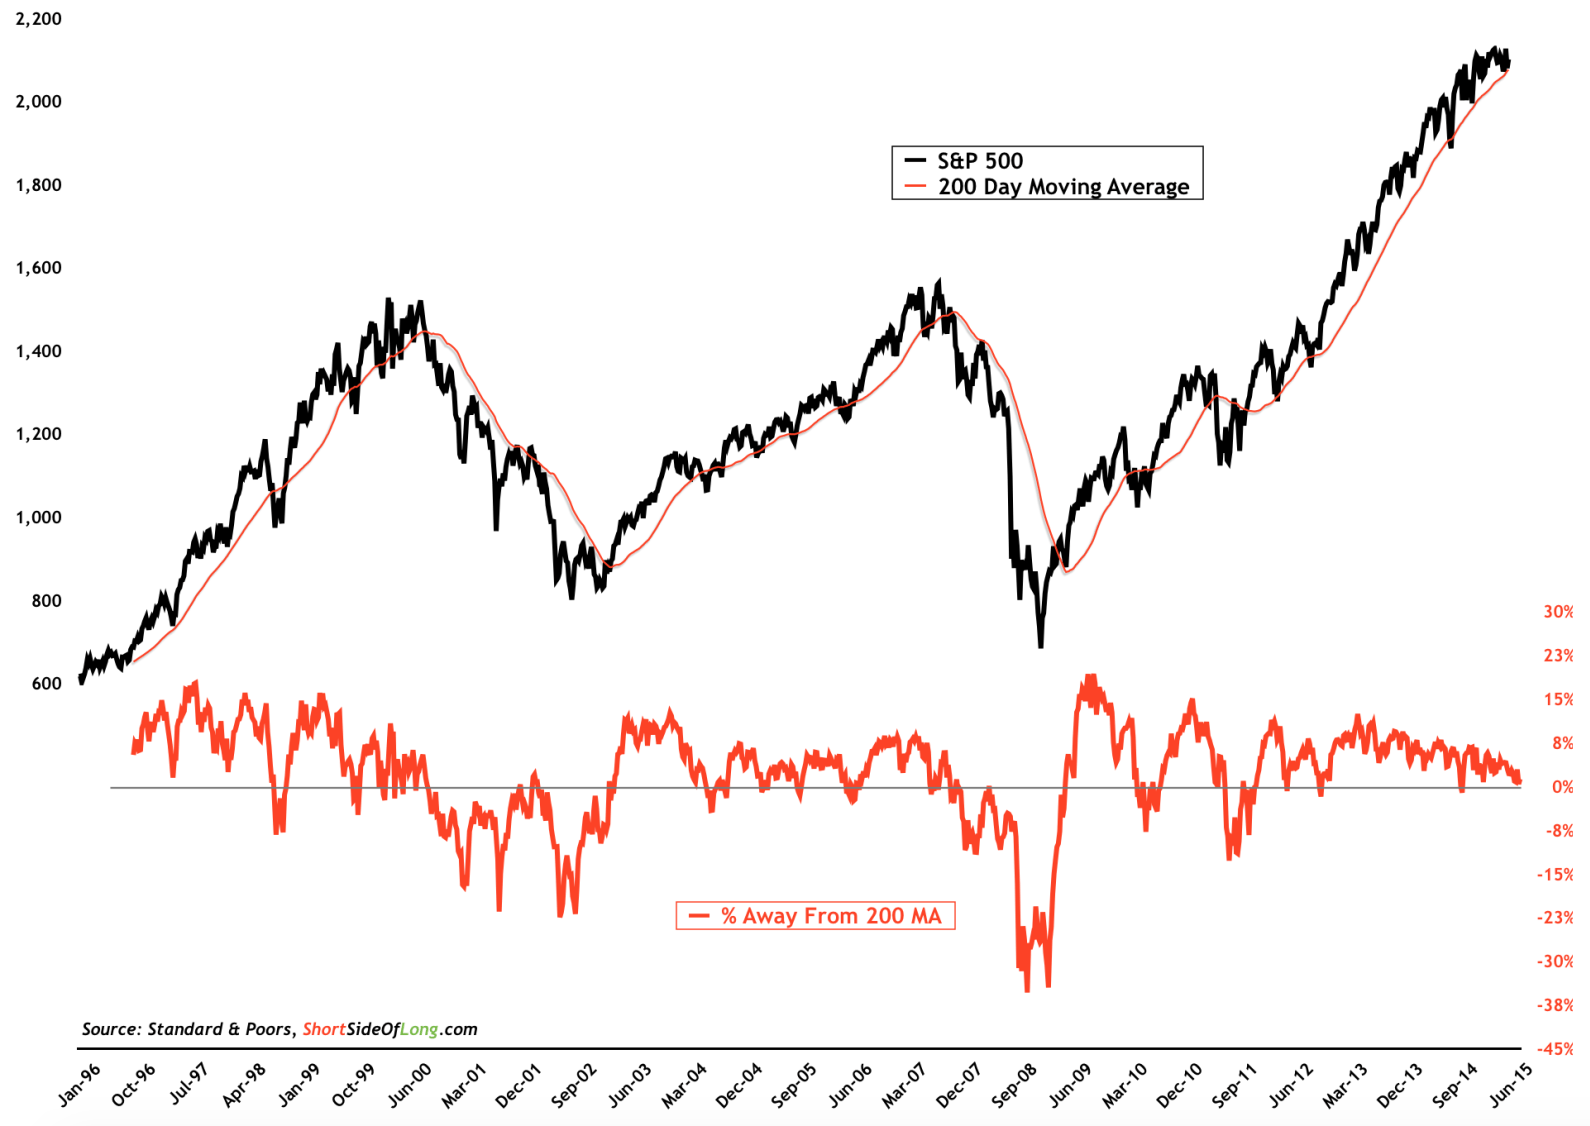
Chart Of The Day: S&P 500 has managed to stay above its 200 day moving average
Source: Short Side Of Long
A lot of technicians have been following the price of S&P 500 very closely in recent days. After a 5 consecutive day decline towards its 200 day moving average, it was make or break for the US equity market. So far so good, as the index managed to stage a 40 point rally (at the time of writing this). After trading above the 200 day MA for 183 out of the last 187 weeks, the question is: does S&P 500 have the legs to carry it towards new record highs or is this a short term bounce? The key to answering that question and future direction of the market lays with market breadth participation. In other words, despite a seven month sideways trading range, there is a lot more going on underneath the surface.