


For this week's SIA Equity Leaders Weekly, we are going to look at two sectors within the Canadian market that have provided significant outperformance over the past 3 years at a time when the S&P/TSX Composite Index has lagged relative to many other markets around the world. Using SIA's Matrix Position Chart helps to identify investments that are showing relative strength vs its peer group and provides an objective perspective of global money flows. We will use the SIA ALL CAD ETF Report to help us identify the two outperforming Canadian sectors over the past 3 years.
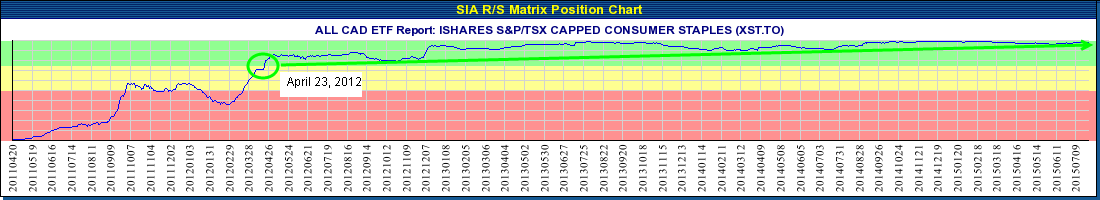
iShares S&P/TSX Capped Consumer Staples ETF (XST.TO)
XST.TO moved into our Favoured Zone of the SIA ALL CAD ETF Report back on April 23, 2012 @$22.07. As of July 28, 2015 XST.TO closed @$47.65. That is a cumulative return of 116% or a CAGR of 26.26%. Compare this to the cumulative return of 29% for the iShares Core S&P/TSX Capped Composite Index (XIC.TO) or a CAGR of 7.78% over the same timeframe. While the TSX Composite Index significantly lagged many world markets over this timeframe, specific pockets of strength could have been found within this market and added to your clients' portfolios. A simple review of the ETFs within the Favoured Zone of the SIA ALL CAD ETF Report would have alerted you to the few bright spots within the Canadian market during this time.
Disclosure: XST.TO is presently held within certain portfolios managed by SIA Wealth Management Inc.
Click on Image to Enlarge
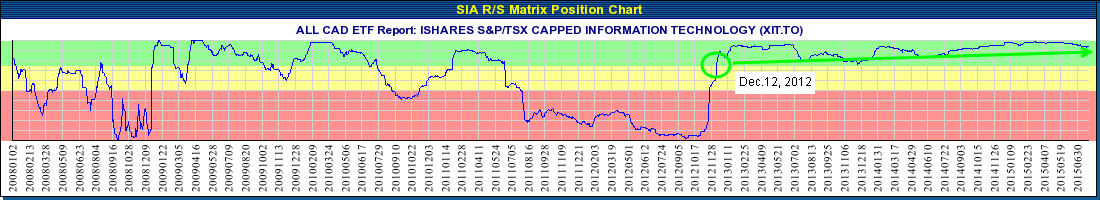
iShares S&P/TSX Capped Information Technology ETF (XIT.TO)
XST.TO moved into our Favoured Zone of the SIA ALL CAD ETF Report back on Dec.12, 2012 @$6.43. As of July 28, 2015 XST.TO closed @$12.24. That is a cumulative return of 90% or a CAGR of 27.76%. Compare this to the cumulative return of 23% for the iShares Core S&P/TSX Capped Composite Index (XIC.TO) or a CAGR of 7.83% over the same timeframe. This sector has provided significant outperformance over the broad Canadian market during this time period and could be found easily within the SIA ALL CAD ETF Report.
For further discussion on using our SIA ALL CAD ETF Report within your clients' portfolios, you can contact our customer support at 1-877-668-1332 or siateam@siacharts.com.
Click on Image to Enlarge
SIACharts.com specifically represents that it does not give investment advice or advocate the purchase or sale of any security or investment. None of the information contained in this website or document constitutes an offer to sell or the solicitation of an offer to buy any security or other investment or an offer to provide investment services of any kind. Neither SIACharts.com (FundCharts Inc.) nor its third party content providers shall be liable for any errors, inaccuracies or delays in content, or for any actions taken in reliance thereon.