Momentum systems are popular because they are supposed to generate excess alpha at lower risk. However, as in the case with traditional trading systems, momentum represents just another method that must be tested for significance and, more importantly, for intelligence in capturing alpha.
One cannot simply appeal to academic studies that demonstrate the momentum anomaly effect and then claim that there is a general method for transforming this effect into excess alpha. All trading hypotheses must be analyzed on a case-to-case basis. Part of the analysis could be testing the following hypothesis regarding backtested or even real performance:
Ho: The method possesses intelligence
H1: The method does not possess any intelligence
By “possessing intelligence” it is meant here that a system was not curve-fitted on past data or was lucky in actual trading but that its returns were due to its ability to adjust to changing market conditions.
In general, testing strategies for intelligence is an edge in itself and separates winners from potential losers. Here is an example of testing the 50-200 golden cross system for intelligence. Note that this type of testing cannot be generalized, although some have unsuccessfully attempted that. It is a scientific process but it is also an art.
After this short introduction, I will use as an example a recent blog by Scott’s Investments blog (reference included at the end) about a system based on relative and dual momentum to demonstrate how backtest results can vary depending on selection of the starting date of the tests. This type of analysis is often part of the analysis done to test such methods for intelligence.
The tests in the mentioned blog were conducted using Portfolio Visualizer. Although this looks like an excellent free service, in general I avoid using a backtester that I have not tested thoroughly myself and have in-depth knowledge of its operation. Note that in the 1990s, two of the most popular backtesters used by thousands of traders were flawed as I have documented in detail in unpublished papers. This is one reason I developed my own backtester as part of my Price Action Lab software. For the purpose of this blog I also checked the results in another backtester I trust.
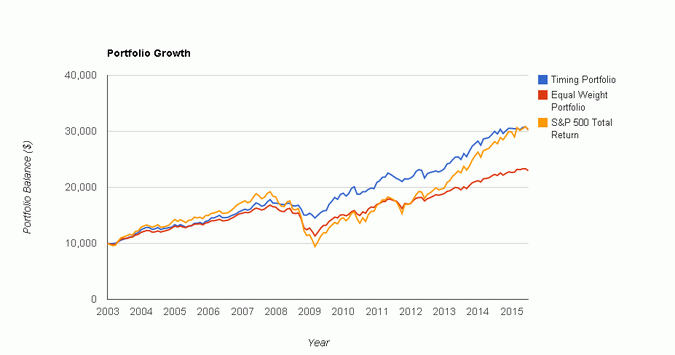
In the referenced blog, a rotation strategy using four Vanguard allocation funds was shown to beat S&P 500 total return for the tested period. I will not show the original charts here as they are available in the reference. The test period was from 01/1996 to 07/2015 and a 5-month total return was used as the score. However, this is what happens when the starting date is changed to 01/2003 in the case of the relative momentum system:
Below are the detailed performance results:
It may be seen that the CAGR for the timing portfolio and S&P 500 total return are equal although drawdown is different. The performance shown is before any commissions and slippage.
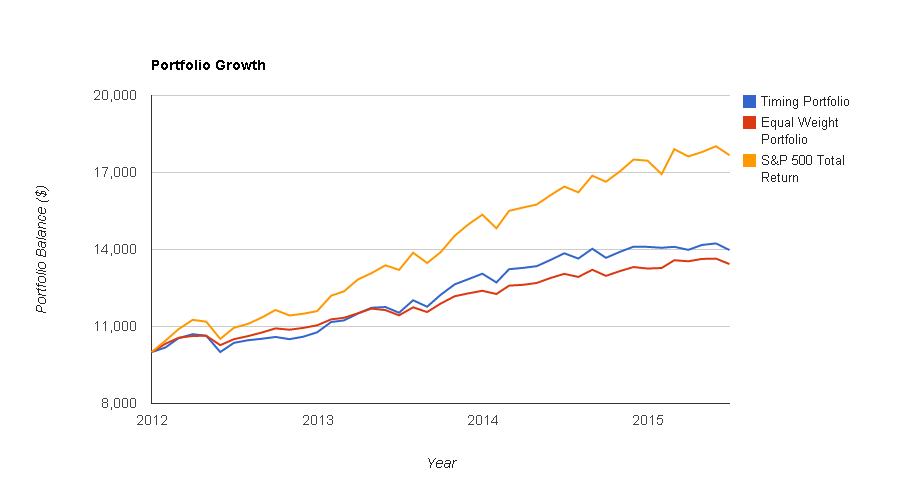
Next I changed the starting date of this relative momentum strategy to 01/2012. Results are even more interesting:
It may be seen that the S&P 500 total return outperforms the relative momentum strategy by a wide margin of more than 7% annually and drawdown is about the same, as shown below:
The original report reflects (unintentionally) a test period with selection bias at work. What appears as significance outperformance in one test period changes to significant underperformance in another test period. The change in performance indicates that the results of this relative momentum system in the original test period from 01/1996 could be due to a curve-fit and such a system may lack intelligence to adjust to changing market conditions.
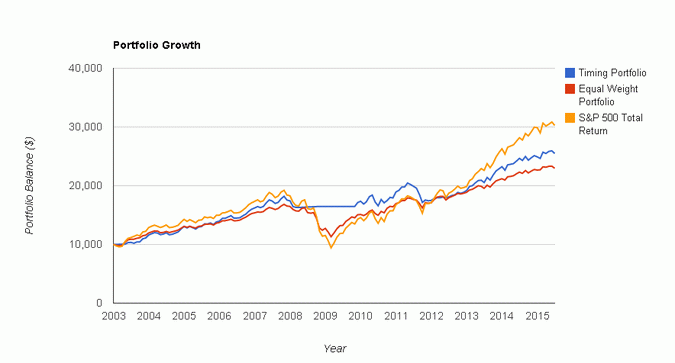
Let us also consider the dual momentum results. The mentioned blog also reported significance outperformance for the test period from 01/1996. This is what happens when the start date changes to 01/2003:
Below are the detailed performance results:
CAGR for dual momentum is about 150 basis points lower that S&P 500 total return but drawdown is lower due to diversification during the 2008 downtrend.
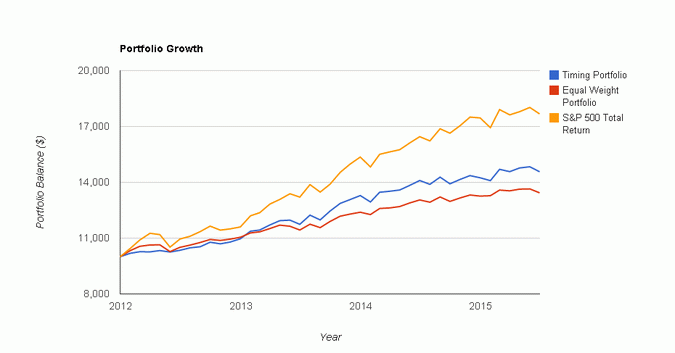
Next are dual momentum results with the test starting on 01/2012:
In this case the annual return for the dual momentum systems was about 300 basis points less than S&P 500 total return at comparable drawdown.
Conclusion
If a fund manager shows you a nice backtest or even real results over a certain period of time, will you conclude that he has a sound trading or investing method? Actually, you should ask for detailed stress analysis that includes different time intervals and detailed quarterly results among other things. Momentum, relative, dual or whatever you may call it, has not performed as expected in recent years (other than in data-mined cases) because of several reasons that are beyond the scope of this blog. However, the most important of those reasons is that momentum systems are not intelligent enough but represent a trivial way of trying to capture excess returns. The market has reacted in recent years to such trivial rotation schemes by refusing to let them generate excess returns. This is an ongoing process of eliminating the anomaly of trying to take advantage of a structural anomaly effect and the market is very good at this. Instead, the market is rewarding in recent years those that have put faith in the benchmark. I believe that momentum methods will soon join the ranks of problematic strategies. I am not saying this because I have something against these methods or the people that promote them. I say it because of experience. These methods remind me of how nicely moving average crossovers worked in the 1980s until they suddenly stopped, ruining many traders and funds. After all, it may be naive to think that it suffices looking at past returns for realizing future returns. That would be an extraordinary anomaly.
Copyright © Price Action Lab


