by Ben Carlson, A Wealth of Common Sense
It’s now been nine years since the Federal Reserve last raised the fed funds rate. The speculation grows by the week about when the first rate hike since 2006 will occur. Every economic data point that gets released is immediately put into terms about what it means for the potential for a rate hike.
I decided to look back at the past fed fund rate cycles to see how the current drought between rate increases stacks up historically. Federal Reserve data on the fed funds rate only goes back to the start of 1956, so we have around 60 years’ worth of data to work with. This table show each rate hike cycle along with the length of time it took to see another rate hike by the Fed to start the next cycle*:
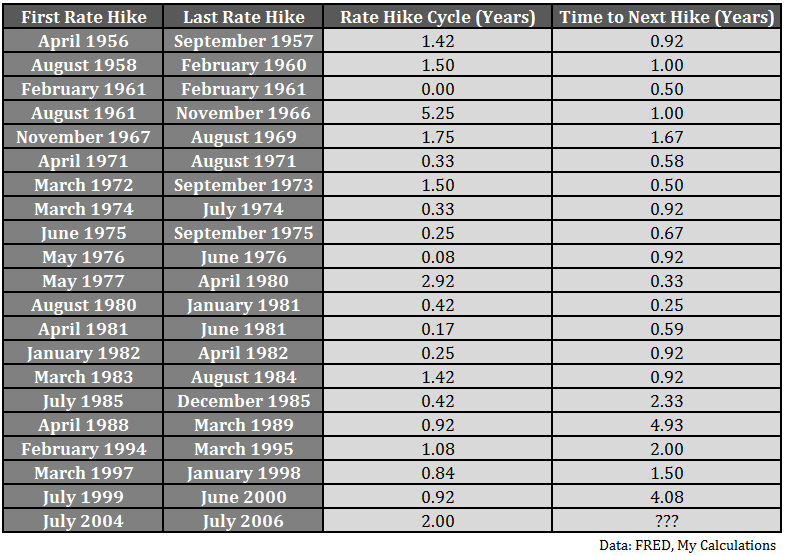
The most striking thing about this data to me is how short these cycles have been. In this period, the longest the Fed waited between rate hikes was nearly five years, from 1989 to 1994. The average time in-between past rate hikes was just under a year and a half. So everything Fed-watchers have been saying for the past few years seems to apply. We’re in uncharted territory. It’s unprecedented monetary policy. The Fed is (possibly) behind the curve.
Finance people hate to admit this, but this time really is different. The recession was more severe and the recovery has been slower than we’ve seen in some time. Therefore, there’s not much of a post-WWII precedent for comparison purposes as the current business cycle is unlike any we’ve seen in this time. This is why economists and investors have had such a difficult time handicapping what’s going on with regard to economic growth and the path of interest rates. It seems everybody has been applying models that aren’t relevant to the current situation.
Many investors have pointed to the fact that stocks have tended to perform just fine during past periods of rising interest rates, which is counter-intuitive to financial theory. What most people fail to realize is that the biggest reason for this outcome is probably the fact that rates have risen in the past quite often. Take a look at the historical graph of the fed funds rate courtesy of FRED:
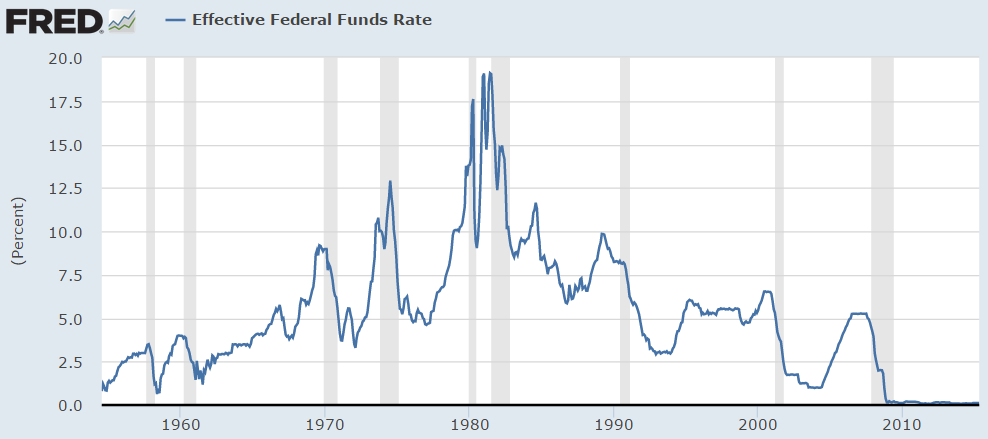
Using the data in the table above, I calculated that the Fed was in the process of raising rates for almost 24 years during this time. That means 40% of the time the fed funds rates was actually in a rising rate environment since 1956. Considering that stocks are up roughly 75% of the time, you would expect some of the overall rise in stocks to come during periods of rising rates since they’ve occurred so often.
Many investors are quite nervous about the potential for a rising interest rate environment. It’s a legitimate concern, but I imagine most investors don’t realize how often the Fed has risen rates historically. The longer we’re forced to wait for the inevitable first rate hike from the Fed, the greater the speculation will become on the path that interest rates will take when it finally begins.
It’s an intellectually stimulating exercise to guess what the Fed will do next. Using history as a guide isn’t going to be much help from here on out.
Further Reading:
What Happens to Stocks & Bond When the Fed Raises Rates?
When Will the U.S. Have Its Next Recession?
Subscribe to receive email updates and my quarterly newsletter by clicking here.
Follow me on Twitter: @awealthofcs
My new book, A Wealth of Common Sense: Why Simplicity Trumps Complexity in Any Investment Plan, is out now.
*I measured each cycle in this data set from the first rate increase to the next rate decrease.