
For this week's SIA Equity Leaders Weekly, we are going to discuss a simple but powerful approach to identifying key sectors and maximizing your return potential using ETFs. We have made the process of identifying key opportunities and maximizing its return potential very easy to implement into your investment process through our SIA ALL CAD ETF Report for Canadian advisors. To illustrate this process we will discuss 2 ETFs, the BMO Equal Weight U.S. Health Care ETF (ZUH.TO) and the iShares S&P/TSX Capped Consumer Staples ETF (XST.TO). The last time we wrote about these ETFs was back in Dec.24, 2014, please see this commentary for a more detailed review of its performance at that time.
BMO Equal Weight U.S. Health Care ETF (ZUH.TO)
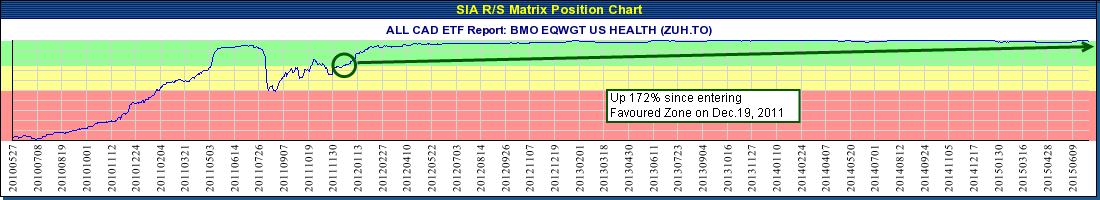
The SIA ALL CAD ETF Report consists of almost 300 ETFs listed on the TSX that are diversified by Asset Classes, Sectors, Geographic Regions, USDCAD and Passive vs Active ETFs (ie. Smart Beta). By calculating the Relative Strength rankings of this list, we get a powerful perspective of global money flows through these ETFs. This eliminates the need for "guesswork" regarding what to buy and when and provides a micro perspective of strength in the marketplace. For example, the health care sector was something we were told to invest in 15 years ago as many analysts made the case for the aging baby boomer population and the need for greater health care services and facilities. However, health care as a sector essentially traded sideways for 10 years only breaking out to the upside in 2011. Had you tried to forecast the rise of this sector from a fundamental perspective, you could have waited a long time before achieving any real return from this trade. By simply aligning yourself with the market, our methodology would have alerted you to long term strength in health care back on Dec.19, 2011 as ZUH.TO entered the Favoured Zone of the SIA ALL CAD ETF Report at a price of $16.42. For the next 3.5 years ZUH.TO remained at the top of the Favoured Zone showing consistent leadership relative to its peer group of ETFs within this Report. As of July 7, 2015, ZUH.TO closed at $44.65 for a cumulative return of 172% during this timeframe. Understanding the power of Relative Strength can enable you to not only identify areas of strength in the market, but also to keep you in that trade for as long as the trend continues.
Disclosure: ZUH.TO is presently held within certain portfolios managed by SIA Wealth Management Inc.
Click on Image to Enlarge
iShares S&P/TSX Capped Consumer Staples ETF (XST.TO)
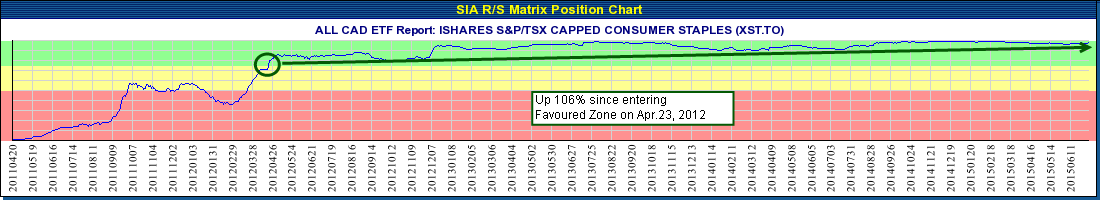
The S&P/TSX Composite Index has essentially moved sideways for the last 4.5 years providing a cumulative return of 2.61% since early 2011. However, if you knew where to look there were some bright spots within the Canadian marketplace that provided significant returns over and above the index. One example of this was XST.TO. Since entering the Favoured Zone of the SIA ALL CAD ETF Report back on Apr.23, 2012 at a price of $22.15, it has risen to $45.72 since the close of July 7, 2015. This was a cumulative return of 106% during this timeframe. Relative Strength investing is often an exercise in "patience". A particular segment of the market will begin to show up within our Favoured Zones without any fanfare or significant announcement by the "talking heads". It almost moves in "stealth mode" in the beginning and one of the only ways you even notice it is because it shows up in the Favoured Zone. It is not uncommon for you to scratch your head in confusion asking why this segment of the market is now showing strength, especially given that nobody is talking about it? However, something else is happening beneath the market that is providing support to this trade and our philosophy is to align with that support. There will be times when an ETF will move into the Favoured Zone and then move back down again. This is not a mistake, it is simply the normal ebb and flow of the markets. Don't be dismayed at having to sell an investment you just purchased as this is part of the process of trying to identify those ETFs that will be in a long term uptrend. Since nobody has a crystal ball on the future, an objective approach of aligning yourself with global money flows simply increases the probability that you will be able to "let your winners ride and cut your losses short!" It is a highly disciplined and repeatable process of uncovering the best risk/reward relationships in the market at any given time with an objective approach to entering and exiting those positions.
Disclosure: XST.TO is presently held within certain portfolios managed by SIA Wealth Management Inc.
Click on Image to Enlarge
SIACharts.com specifically represents that it does not give investment advice or advocate the purchase or sale of any security or investment. None of the information contained in this website or document constitutes an offer to sell or the solicitation of an offer to buy any security or other investment or an offer to provide investment services of any kind. Neither SIACharts.com (FundCharts Inc.) nor its third party content providers shall be liable for any errors, inaccuracies or delays in content, or for any actions taken in reliance thereon.
For a more in-depth analysis on utilizing the SIA ALL CAD ETF Report for your ETF strategies, you can contact our customer support at 1-877-668-1332 or siateam@siacharts.com.
Copyright © SIACharts.com