
by Tiho Brkan, Short Side of Long
Chart Of The Day: Crude Oil has has become short term overbought!
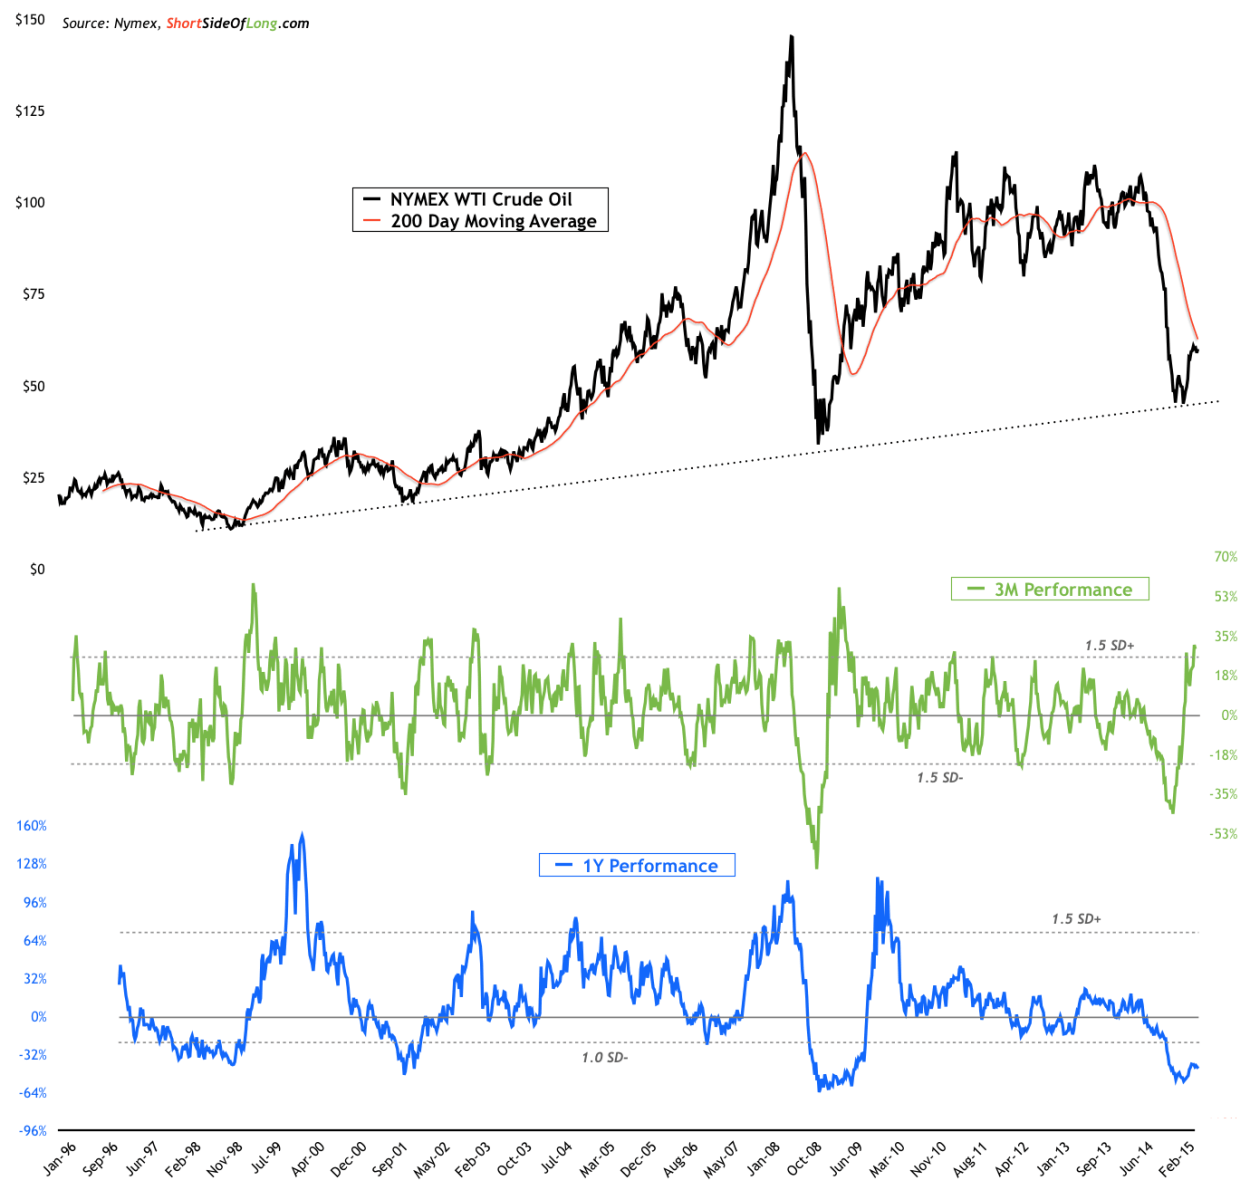
Source: Short Side Of Long
Today's chart of the day focuses on Crude Oil. Those market participants with a keen eye on tape, would have noticed that Oil prices have been in a sideways pattern throughout the whole of May and June. While Crude Oil remains extremely oversold from the longer term perspective (blue indicator is annualised performance), at the same time it is also very much overbought in the short term (green indicator is 3 month performance). Furthermore, Crude prices find themselves approaching the 200 day moving average (red line), which will most likely try to act as a resistance. Most investors are now wondering whether Crude recovery be similar to 2009, when the rally just kept going...
Copyright © Short Side of Long