by Adam Butler, GestaltU
Rob Seawright of Above the Market recently posted an article broadly skewering tactical asset allocation (TAA) strategies. He cites the failure of market gurus to pick market turns (from a CXO analysis we’ve discussed in the past), and a Morningstar study showing that TAA has under-performed the Vanguard U.S. 60/40 balanced fund over the past few years (hearsay from a Larry Swedroe article here).
With all due respect to these distinguished financial professionals, we’re here to tell you that the analyses these authors have used to dismiss TAA is flawed. Specifically:
- The authors are under the misapprehension that TAA requires discretionary market calls;
- They’ve lumped vastly different strategies together for judgment; and
- They have evaluated the success of TAA relative to a poorly specified benchmark, and over a biased time period.
This article will discuss each of these issues in turn, and comprehensively demonstrate why TAA will probably improve the performance of any diversified portfolio.
TAA Does Not Require Discretionary Market Views
First, it should be abundantly clear from previous articles that those ‘strategists’ who purport to be able to call market tops and bottoms based on their own discretionary analyses are doomed to fail. We’ve spilled a lot of ink on this topic in the past, which we will not recapitulate here, but we would encourage those who are not yet persuaded of this fact to read our article, “Predicting Markets, or Marketing Predictions” here. But in truth, this issue is a red herring because discretionary market calls are not required for successful TAA.
The best TAA strategies systematically harness well documented market anomalies, most notably value and momentum. These anomalies, which have been observed in markets as diverse as commodities, fine art, tulip bulbs, wine, real estate, interest rates, and equities, do not require successful discretionary judgment. Rather, they are endogenous to all markets because of pervasive behavioural biases; structural issues, and; risk exposures.
Now, some skeptical market commentators dismiss these factors (like value and momentum) on the basis that, once these anomalies have been broadly identified, rational actors will arbitrage away the opportunity. However, both value and momentum have compelling theoretical foundations which explain their ubiquity and persistence. Furthermore, they exhibit levels of statistical significance that are difficult to ignore. In fact, the statistical evidence in support of the value and momentum factors is even stronger than the evidence that stocks produce higher returns than t-bills. Don’t believe us? Consider Figure 1. below from a recent paper evaluating the statistical evidence for a wide variety of proposed market factors. Note that the HML (value) and MOM (momentum) factors exhibit t-scores of almost 5 (circled in green), while MRT (CAPM market excess return factor, circled in red) yields a t-score of just over 2.5 (note that higher t-scores indicate higher levels of statistical significance – more on this below).
 Source: Harvey, Liu and Zhu, 2014Even the most ardent market skeptic would be pressed to dismiss the fact that stocks are expected to deliver higher returns than t-bills over the long term. Clearly this has been known by all investors intuitively for many centuries, even if it was only proven statistically in the 1970s. Yet investors continue to expect higher returns from stocks, even though everyone has known about this anomaly for decades. Why have investors not arbitraged away this excess return? The answer is obvious: investors are compensated for taking on extra risk.
But the value and momentum factors have equally plausible arguments for persistence. Taking advantage of the ‘value’ factor often requires investing in ‘distressed’ assets (though recent observations about value’s interaction with ‘quality’ contradict this interpretation), and enduring long periods of underperformance relative to a market cap weighted benchmark (nothing works all the time). Furthermore, value investing is a highly contrarian activity, which requires people to take strong actions against prevailing market views, which is a source of emotional pain for most people.
Momentum requires purchasing assets once they have already appreciated substantially, which is counterintuitive for many investors. Momentum is also partly explained by Prospect Theory, and in particular the ‘disposition effect’: investors prefer to sell their winners to lock-in gains, and these actions interfere with stocks’ ability to reach a higher equilibrium price. Also, new information that impacts the price of an asset does not reach all market participants at once. As each marginal investor incorporates the news into price expectations, assets slowly move toward – and often beyond – their equilibrium price.
Many commentators, who embrace these factors within asset classes (i.e. for picking individual stocks), have chosen to ignore their existence at the asset class level, despite similar theoretical underpinnings and statistical significance. Asness, Moskowitz and Pedersen extended tests of the momentum and value factors into broad asset class portfolios and discovered that the value and momentum effects were even stronger across asset classes than in selecting individual stocks (see Figure 2). This is true for both long-only (P3 column) and long-short (P3-P1 column) factor portfolios, where the t-stats (i.e. statistical significance) for global asset class value and momentum factors exceeded respective factors for global stocks. Specifically, the authors found a t-stat (alpha) of 3.04 for long-only asset class momentum vs. 2.78 for long-only global stock momentum; the t-stats for long-only value on asset classes vs. global stocks were 3.71 and 3.49 respectively. I would note that an absolute t-statistic greater than 2 reflects a less than 5% chance that the observed results are due to random chance; an absolute t-statistic greater than 3 reflects a less than 1% chance of spurious results.


Source: Asness, Moskowitz, Pedersen, Value and Momentum Everywhere
In more basic language, this table illustrates two important points. First, it shows that momentum and value effects exist at highly significant levels across both global stocks and global asset classes. Second, it would be very difficult for a commentator to acknowledge the persistence of these factors as they pertain to stocks without also acknowledging their persistence across global asset classes. If you acknowledge one, you must logically acknowledge the other. A person who asserts any other conclusion is selling something.
In summary, while the evidence is clear that no one can successfully forecast market turns, this fact is unrelated to the potential of GTAA. Rather, the key to successful Global Tactical Asset Allocation is to rely on proven factors by systematically biasing portfolios toward the cheapest or highest momentum sectors of global markets.
Defining GTAA
Commentators who dismiss GTAA often cite the performance of the Morningstar Tactical Asset Allocation fund category over the past few years. We’ll address the issue of poorly specified benchmarks below, but in fact the issue runs deeper than this. The problem is that, unlike most Morningstar categories where funds are grouped according to clear investment styles and factors, the TAA category is more of a hodge-podge of funds, which Morningstar can’t easily classify elsewhere in its index lineup.
For example, consider the Horizon Active Asset Allocation fund (AAANX), with the ability to invest in ETFs tracking equity markets, REITs, commodities, currencies, credit and rates around the world. The fund has a turnover of 600%, and a quick look back through monthly reports shows a very active and diverse set of holdings representative of a broad investable universe. While their stated benchmark is the S&P 500 equity index, and a quick scan of historical holdings does show a bias toward global equities, the fund is clearly both ‘global’ and ‘tactical’.
On the other extreme, the Morningstar TAA category also includes the Good Harbor Tactical Core US strategy, which has a narrow investible universe of U.S. equity sectors and U.S. Treasury bonds. There is clearly nothing ‘global’ about this strategy, though it is certainly tactical, switching into 100% bonds or 100% stocks in any given month.
The Morningstar TAA category also includes U.S. sector rotation funds such as Innealta Capital Sector Rotation Fund, as well as global risk parity funds, target risk funds, and other mandates which may or may not be either tactical or global. Obviously, we need a better classification methodology that creates a more homogenous group of true GTAA mandates.
Fortunately, Morningstar also publishes a quarterly “Morningstar ETF Managed Portfolios Landscape Summary” report, which provides a more granular taxonomy of tactical strategies. In addition, the proposed taxonomy aligns well with what we believe are the obvious hallmarks of GTAA strategies, namely:
- Diverse global universe of investible asset classes
- Flexible mandates with few portfolio constraints
- Process involves large tactical shifts in portfolio holdings to take advantage or short- or intermediate-term opportunities
- Liquid investment vehicles primarily composed of passive beta products including ETFs
The Morningstar Landscape “Global All Asset” category maps very closely to these criteria. It includes both ‘hybrid’, ‘strategic’ and ‘tactical’ funds with appropriate global universes and flexible mandates. In our estimation, Tactical strategies in the Global All Asset category best match the criteria for GTAA.
Now that we have defined a category for GTAA and identified a group of strategies that fall into the category, it’s time to talk about performance – but against what benchmark? We discuss this next.
Performance and Benchmarking
One of the most common failings of the investment industry is the prevalence of poorly specified benchmarks. This is of critical importance because it is easy for a knowledgable but disingenuous professional to manipulate the facts in order to make any point they want. Want a simple way to boost results? Choose an easy benchmark for comparison. Want to dismiss performance? Choose a challenging benchmark. Of course, the choice of benchmark for persuasive purposes is highly sensitive to the time period under analysis.
Investment commentators who dismiss TAA often compare the results of TAA strategies to a U.S. 60/40 balanced fund like the Vanguard Balanced Fund (VBINX). And this benchmark does have one thing going for it, especially if a commentator’s goal is to malign TAA strategies: It is a very tough benchmark to beat over the past one, three and five years – perhaps the toughest in the world in USD terms. Unfortunately, it’s hard to see how this portfolio represents an appropriate bogey for GTAA strategies over the long-term.
For one, this portfolio is insulated from global currency effects, which have been especially pronounced in the past few years with global QE programs in effect. Second, it ignores non-U.S. equity beta; while a focus on U.S. equities at the expense of international stocks has been a lucky bet for the past few years, it ignores the broader scope of GTAA strategies. Also, since the goal of GTAA strategies is to harvest premia from as many liquid global sources as possible, the strategies often incorporate alternative investments, like REIT and commodity ETFs, into their investible universe. These are not represented in a U.S. balanced fund benchmark.
Fortunately, Morningstar takes a broader view in their Landscape report. Their Global All Asset benchmark, copied below (Figure 3.) is composed of 55% global stocks, presumably distributed geographically by market cap; 35% global bonds, split evenly between US and international; and 10% commodities. Clearly the folks at Morningstar are trying to be more representative of the space, and their mix is certainly in the right ballpark. But it is also still rather arbitrary – how did they arrive at their weights? Have they weighted toward historical GTAA holdings? If so, is there any guarantee that historical holdings will be representative of future holdings? These are dynamic strategies after all. Do commodities deserve a 10% strategic weighting or is this informed by recency bias? In addition, the Morningstar benchmark is over 80% weighted to U.S. dollars. Does this represent a neutral currency policy?
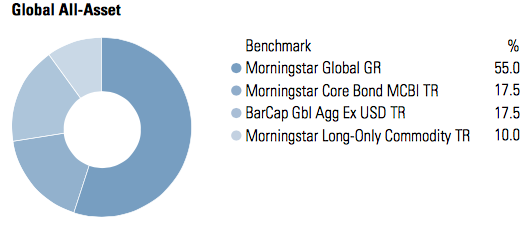
Source: Morningstar
It’s worth spending a moment on how we might judge the adequacy of a benchmark in general. At root, a well specified benchmark should be expected to meet the following criteria:
- It is passive;
- It is investible; and,
- It reflects the investing opportunity set of the manager.
Sharpe (1962) showed that in order for a portfolio to be truly ‘passive’, it must be structured such that it can accommodate all participants in the market at the same time. Axiomatically, a passive portfolio must be representative of the average investor portfolio, because this is the only portfolio that all participants can hold at once. For proof, let’s simplify the problem. Consider 20 marbles divided among 4 people: Jane with 3, Alex with 9, Stephen with 7 and Marco with 1. On average they hold 5 marbles (3 + 9 + 7 + 1 = 20 / 4 people = 5); it follows that the only configuration of marbles where each of the 4 people can hold the same ‘portfolio’ of marbles is if each person has 5 marbles. In markets, the neutral portfolio that represents the average positions of all market participants is the portfolio that holds each asset in proportion to its market capitalization. In other words, the market cap weighted portfolio.
This is not a new concept; U.S. large cap equity managers are typically benchmarked against a market cap weighted index of large-cap U.S. stocks. U.S. Investment Grade bond managers are be benchmarked against a market cap weighted index of U.S. listed investment grade bonds. Cap weighted indexes are common and intuitive when they are constructed within a major asset class.
But the concept is also easily extended into a multi-asset class context. In this case we would expect a passive portfolio to hold all asset classes in proportion to their respective market capitalizations. Consider a simple example where the aggregate global market has a value of $100 trillion, where $50 trillion is stocks and $50 trillion is bonds. In this case, a passive investor would hold 50% of their portfolio in bonds and 50% in stocks. Every participant in the markets could hold this exact portfolio without changing the overall composition of the market, so it is the only passive, neutral portfolio.
As discussed in prior posts (see here and here) Doeswijk et. al. determined the actual market value of every global financial asset (as of year-end 2012) and published their relative market capitalization weights in a 2014 paper. These weights describe the most passive portfolio possible: the global market cap weighted portfolio (GMP). Fortunately, an investible version of this portfolio can be very closely replicated with low-cost, U.S. listed ETFs (see Figure 5.) This portfolio uniquely meets all the criteria for an appropriate benchmark: it is definitionally the only passive portfolio; it is definitionally investible; and it covers the investible opportunity set for GTAA mandates because it includes all global investible assets.
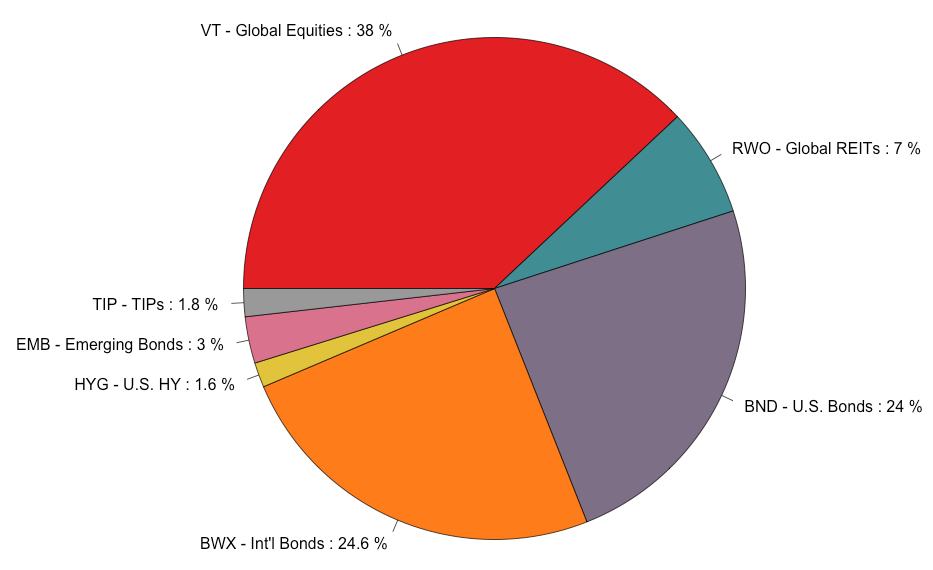
Source: Interpreted from Doeswijk et. al.
We would note that the global market cap weighted portfolio definitionally holds all assets in their native currency, and therefore reflects currency fluctuations in non-domestic asset classes. Over 50% of both global equity and bond sleeves in our proposed global market portfolio reflect non-US currency exposure (the foreign equity exposure is hidden inside our global equity ETF).
All of the ETFs in our GMP proxy portfolio have been trading for more than five years, which makes it simple to construct a total return index for this portfolio to be used as a benchmark. We believe this is the most appropriate benchmark for GTAA strategies. The chart and performance of the GMP over calendar 2014, the three years from 2012-2014, and the five years from 2010-2014 are shown in Figure 6.
Figure 6. Performance of the Global Market Portfolio
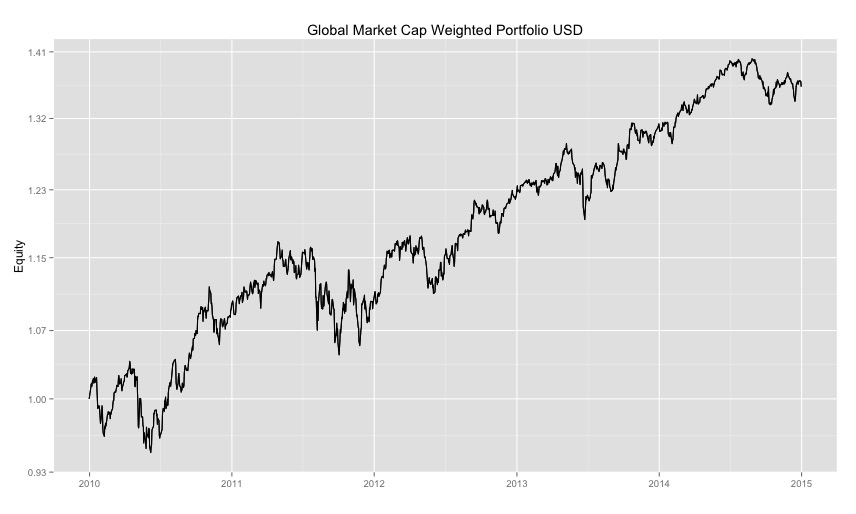

Source: CSI Data
- Do I want a private jet so that I can travel whenever and wherever I want without the hassle of airport lineups? Sure. Do I want it for $6 million plus $250k per year in maintenance costs? No.
- Do I want to invest in a strategy that might make 10% per year? Sure. Do I still want it if the strategy experiences a drawdown of 40% or more about one year in 5? Probably not.
While many managers would debate our preferences, we first look to a strategy’s Sharpe ratio when evaluating GTAA approaches. Many thoughtful consultants and advisors object to the Sharpe ratio because they assert that investors are unconcerned with upside volatility, and focus exclusively on downside risk. While this may be true, in our experience ‘what goes up with volatility is likely to drop with volatility’. This assertion is supported by the tendency for volatility to cluster; the largest down days are often adjacent in time to the largest up days. As such, we perceive the symmetrical character of volatility as a better way to capture the true risk of a strategy than, say downside deviation. That said, we are also interested in non-parametric measures or risk, such as drawdown and ulcer index, as these capture the true risk of a strategy when markets become non-normal, as they often do during crises, and the linearity of the return experience.
Unfortunately, the Morningstar report does not provide absolute risk information, so on an absolute basis we can only observe the benefits (returns) of the strategies, not the costs (risk). However, we can evaluate the relative performance of GTAA strategies by comparing them to our two benchmarks. Morningstar has also blessed us with relative risk-adjusted metrics, so that we can judge the relative merits of a strategy vis-a-vis the benchmark in terms of both relative benefits (alpha) and costs (beta). We extracted the results of the Global All Assets – Tactical strategies with at least 5 year track records in Figure 7.
Figure 7. GTAA performance vs. appropriate benchmarks

Source: Morningstar, CSI Data
A comparison of just the annualized returns for the GTAA strategies relative to the benchmarks shows that they track each other very closely at each horizon, though the average GTAA strategy tracks the GMP more closely than the Morningstar benchmark, especially in 2014. In fact, this is a sign that the benchmarks are well specified. It is also, perhaps, to be expected; the GMP is, after all, the average of all active asset class bets!
On average, the GTAA strategies edged out their benchmarks over the 2014 calendar year, and were even with benchmarks over 3 and 5 year periods. But the story is more interesting once we observe the risk-adjusted characteristics. Note that the GTAA strategies tracked or exceeded their benchmark with less risk, as GTAA betas averaged just 0.8 over the past 5 years. As such, since GTAA strategies provided similar returns with less systematic risk, they delivered alpha of about 1% per year above their passive, globally diversified benchmark. Furthermore, while the average GTAA annualized returns appear to track closely to benchmark annualized returns, the Morningstar benchmark explains less than 70% of GTAA returns, as measured by average R-Squared values. We can therefore conclude that, while the benchmark is relatively well specified, GTAA strategies are harvesting returns from sources other than passive global beta exposures. In other words, their active bets appear to be paying off.
The fact is, the past 5 years have been an extraordinary period for global markets, characterized by a massive recovery in global risky assets coincident with a huge compression in global volatility. Many markets have experienced record consecutive periods without the meaningful corrections we typically observe, even during bull market cycles. As a result, GTAA strategies, which are typically constructed to really shine during crises, have yet to see their day in the sun. In fact, I’m mildly surprised to see that GTAA strategies have competed so well during this bull market phase of the cycle. We won’t get to see just how resilient these strategies are until they stand tall above the detritus of the next bear market.
Copyright © GestaltU