Again with many calls coming in from subscribers asking about the international markets, specifically the emerging markets, for this weeks edition of the SIA Equity Leaders Weekly, we are going to look back at two countries which dominate so many of the ETFs within the SIA International Equity Emerging Markets report: China and India. Looking at both of these huge economies it might be surprising to see such a disconnect as far as their trends for these two 'super' emerging market powers.
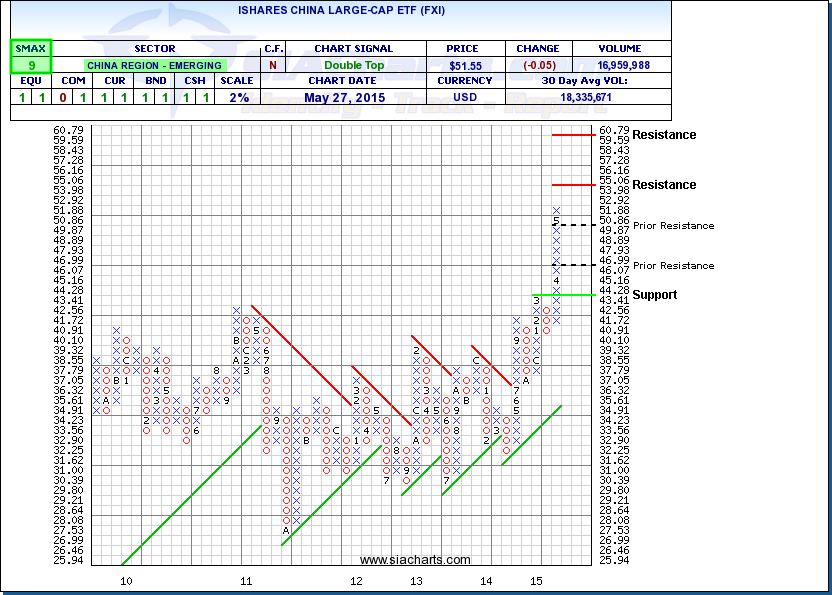
iShares China Large-Cap ETF (FXI)
If looking for exposure to large companies in China, iShares China Large-Cap ETF (FXI) offers access to 50 of the largest Chinese stocks in a single fund. The 50 companies contained in this ETF trade on the Hong Kong Stock Exchange, and the ETF itself sees tremendous daily volume, averaging over $500,000,000 per day.
As can be seen from the chart, FXI has continued to new all-time highs through strong resistance at $47, and then above $50. Further resistance is now seen at $55 and then $60. With an SMAX of 9 out of 10, this China ETF is continuing to show near-term strength against all asset classes.
Click on Image to Enlarge
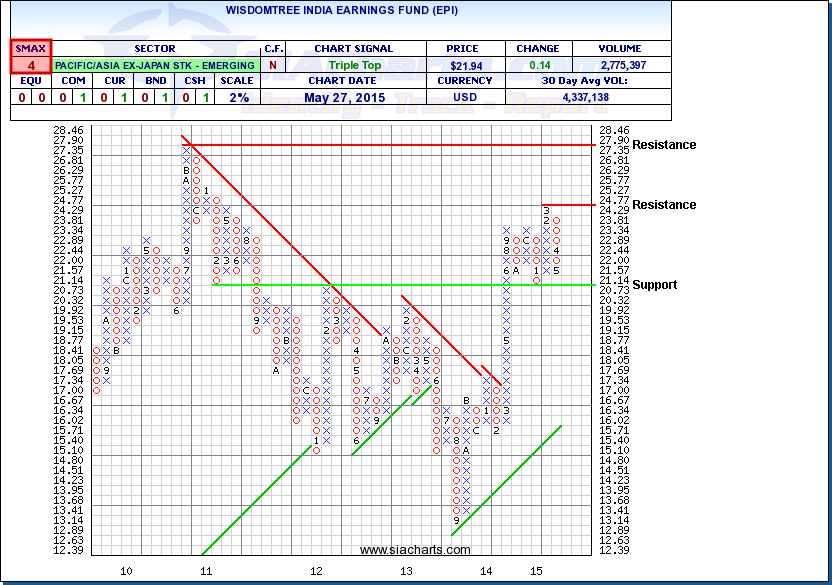
WisdomTree India Earnings Fund (EPI)
Since last looking at the SIA International Equity Emerging Market Report less than 2 months ago when 30% of the Favored zone referenced exposure to India, things have changed very dramatically. A single small-cap name is all that remains within the Favored zone as most have slid recently into the Neutral area.
From the chart of EPI you can see that after early March gains to resistance at $24.77, the shares have slowly moved towards support around the $21 level. Unless it breaks through this level, we can possibly see the India ETF consolidate between the noted support and resistance levels.
The interesting thing to note here is that not all Emerging Markets move together. While China is grabbing all the attention lately, some other emerging plays are showing life such as Taiwan, Philippines, and Russia.
Click on Image to Enlarge
SIACharts.com specifically represents that it does not give investment advice or advocate the purchase or sale of any security or investment. None of the information contained in this website or document constitutes an offer to sell or the solicitation of an offer to buy any security or other investment or an offer to provide investment services of any kind. Neither SIACharts.com (FundCharts Inc.) nor its third party content providers shall be liable for any errors, inaccuracies or delays in content, or for any actions taken in reliance thereon.
Any questions or to learn more about these relationships, other Commodities, or other information, please call or email us at 1-877-668-1332 or siateam@siacharts.com.
Copyright © SIACharts.com