
by Carl Swenlin, StockCharts.com
One of the charts we like to review from time to time is the Mechanical Signal Analysis chart. It shows the percentage of S&P 500 stocks on PMO crossover BUY signals (short-term), and the Percent Buy Index (PBI), which shows the percentage of S&P 500 stocks that are on Price Momentum Model BUY signals (medium-term). A couple of months ago we pointed out the negative divergences on both charts, and as of now those divergences have gotten more pronounced. The percent of PMO BUY signals index divergence is especially severe, currently reading 37% while the market is pushing new, all-time highs. (To clarify, a PMO BUY signal exists when the PMO is above its 10EMA.) Also, notice the most recent indicator top just above 50%, far below the previous prominent tops earlier this year and late last year. This reflects a stunning loss of momentum across a broad range of stocks, and we consider this to be a strong warning sign.
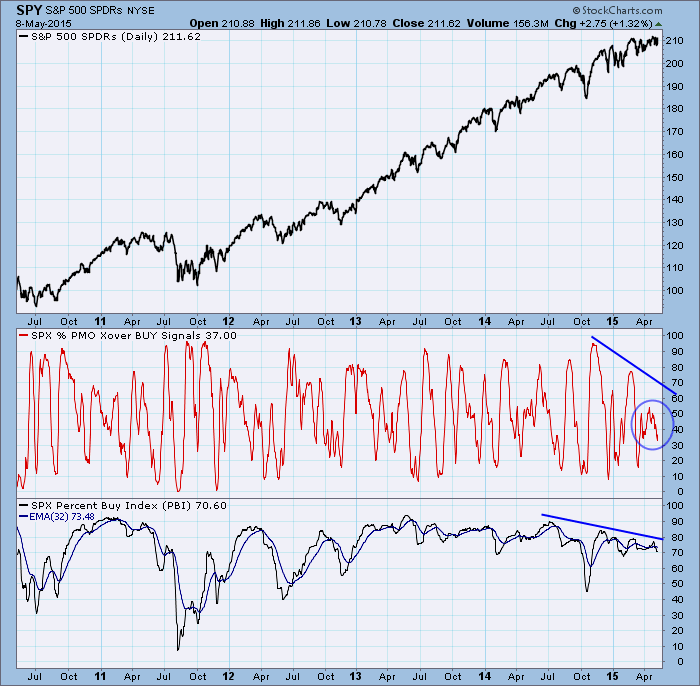
With a reading of 70.6%, the PBI is not seriously low, although it also reflects a gradual deterioration of price support in the medium-term time frame. This condition is reflected in numerous other indicators oriented to this time frame.
Conclusion: While the market has been making new, all-time highs, the signal summaries show that participation of individual stocks within the S&P 500 Index has seriously eroded, particularly in the short term. This situation should not be taken lightly.
Copyright © StockCharts.com