
by Dana Lyons, J. Lyons Fund Management, Inc.
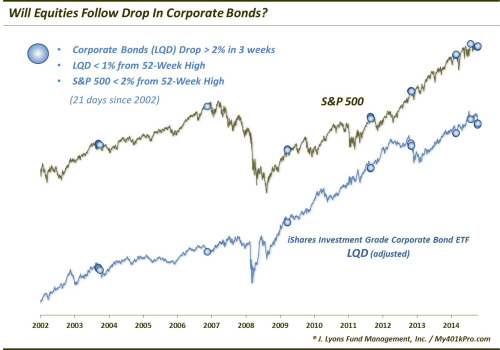
One of the Wall Street platitudes often repeated is that the bond space is the “smart” market, particularly when in conflict with equities. That is, when bonds and stocks seem to be telling opposite stories, it is the bond market that typically ends up being correct. At least that is what the bond traders will tell you anyway. We would have to say, unscientifically, that in our anecdotal experience, there actually does seem to be some truth to this notion, though it can take awhile to pan out. Present market conditions do allow us to look quantitatively at one example of this theory, however. In recent weeks, corporate (and other) bonds have sold off rather steeply. Meanwhile, stocks have more or less traded sideways during that period. So is there any evidence to suggest that the bond market will prove its “smarts” and lead to a sympathetic drop in equities? From a glance at similar historical moves, there just may be.
Here is the setup. As measured by the iShares Investment Grade Corporate Bond ETF, ticker: LQD, corporate bonds have dropped 3% over the past 3 weeks or so. That may not seem like much, but in corporate bond land, that’s in the bottom 2% of all 3-week periods. We took a look at all such sell offs that originated from within 1% of the LQD’s 52-week high. We then narrowed the sample down to those occurring when the S&P 500 was within 2% of its own 52-week high. As it turns out, since the LQD began trading in 2002, there have been 21 such days meeting this criteria.
These 21 days were bunched within 8 unique clusters in the following months:
- April 2004
- June 2007
- October 2009
- March 2012
- May 2013
- September 2014
- February 2015
- May 2015
So let’s cut to the chase. What followed in the bond and, especially, equity markets in the aftermath? Did the bonds prove to be the “smart market”? Here are the results.
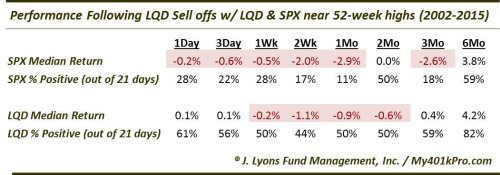
In this case, the bond proponents seem to have a case regarding the IQ of the asset class. While it is admittedly a small sample size, the S&P 500′s returns following the LQD sell offs were well below normal in the short to intermediate-term. 3 weeks out, the S&P 500 was higher following just 1 of the 18 days (3 of the days occurred recently and have not yet generated a 3-week return). Furthermore, the median 1-month return follwing these occurrences was -2.9%. By 3 months, the returns had not gotten much better. Only by the 6-month marker did returns begin to normalize. Keep in mind that these results occurred over a generally favorable period for stocks (2002-2015).
As far as the Corporate Bond Fund, LQD, goes, it too was weaker than normal in the short to intermediate-term, though not as poor as the equities. 1 month following the occurrences, the median return in the LQD was -0.91% versus a median return following all days in the entire period of +0.61%. However, in terms of the percentage of winners, half of the 18 instances saw the LQD higher a month later versus just 2 for the S&P 500.
This study is not going to either validate or refute the notion that the bond market is the “smart” one. Frankly, considering the subjectivity of the cliche, there will never be a definitive answer anyway. Like many of these Wall Street platitudes, the answer will depend upon the bias of the individual considering it. Specifically, it will depend somewhat on one’s experience and somewhat on one’s stubbornness. Experience certainly counts for a lot in this business. But so does an open mind and objectivity. Unfortunately, too often market participants are influenced by a notion that they take for granted even though it has never been properly studied or vetted. The hope is that these individuals are not advising or managing assets on behalf of other people.
As it pertains to this specific case, while the sample size is small, historical precedent comes down on the side of “the bond market being smart”. Given that, the recent decline in corporate bonds from near their all-time highs may be an intermediate-term cautionary sign for equities.
_____________
“Gentoo Penguin” photo by Robert Heil, National Geographic.
More from Dana Lyons, JLFMI and My401kPro.
The commentary included in this blog is provided for informational purposes only. It does not constitute a recommendation to invest in any specific investment product or service. Proper due diligence should be performed before investing in any investment vehicle. There is a risk of loss involved in all investments.
Copyright © J. Lyons Fund Management, Inc.