This week for the SIA Equity Leaders Weekly, we are discussing the concept of "Buying Strength & Selling Weakness." For many, this is a very difficult concept to adopt because for three decades we have been taught that the key to successful investing is to "buy low/sell high." While this is a concept that sounds great in the "classroom" where strategies are developed, it doesn't translate that well onto the "trading floor" where they have to be executed in real-time. This concept, widely adopted by the vast majority, is the primary reason for much of the frustration and disappointment in the investment process for most investors in our opinion.
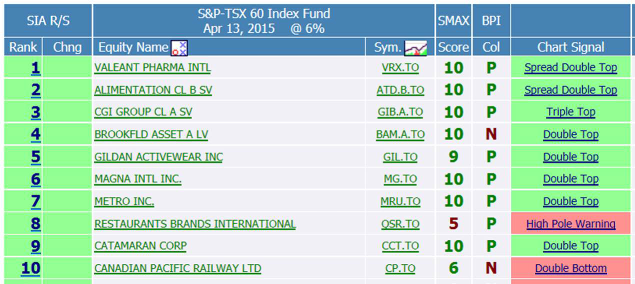
Buying Strength (Top 10 - TSX60 Strategy)
The first challenge in following this concept is defining "what is high" and "what is low?" Since there is no universal standard metric to determine when something is high or low, this decision becomes a "value judgment" and therefore subjective! Using traditional Fundamental Analysis or traditional Technical Analysis to determine what is "high" or "low" requires human interpretation and therefore personal opinion. Ultimately, the ONLY opinion that truly matters is the "dollar weighted collective opinion of all market participants" and we believe the best way to quantify this is through a Relative Strength Analysis of price action! For example, was Apple's price too high after returning 100% in 2009 ($100 to $200 before share split)? Three years later, the stock price had risen another 250%! Many analysts suggested a 100% move in 9 months was extreme and not warranted. The "collective opinion of the market" thought otherwise and pushed the stock price from $200 to $700 in late 2012. Those investors who sold at $200, left significant profits on the table. On the contrary, was Blackberry's price too low after falling 66% in 2008 ($150 to $50)? Four years later, the stock price had fallen to around $6! If an investor had bought this stock at $50 thinking it was "low" because it had already lost 66% of its value, their return four years later would have been -87%!
Relative Strength enables us to align ourselves with the "dollar weighted collective opinion of all market participants" and eliminates the need for subjective analysis, predictions and forecasts and personal opinions! To illustrate this concept, we have created a hypothetical backtested strategy where we chose the Top 10 stocks on a relative strength basis within the SIA S&P/TSX 60 Report on the first business day in January. Then the following January, sell everything and repurchase the new Top 10 holdings of this report. All stocks are equal-weighted and the start date is Jan. 2, 2008. The only other component in this strategy is to overlay our SIA Equity Action Call (Macro Indicator) on this process so when it moves into the Unfavoured Zone, we move to Cash. The results of this strategy compared to its benchmark (iShares S&P/TSX60 Index ETF, XIC.TO) were as follows: ~21.59% CAGR over 7 years v.s ~4.12%, Annualized Std. Deviation of 10.40% vs. 11.90% and Maximum Drawdown of -16.69% vs. -47.16%.
Click on Image to Enlarge
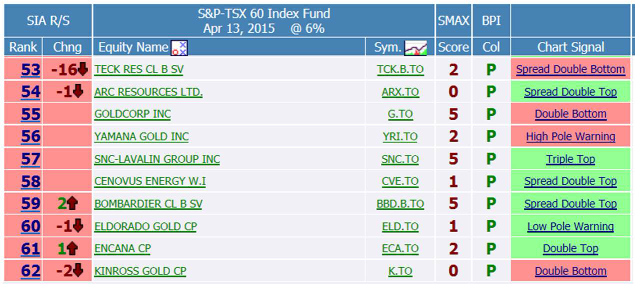
Selling Weakness (Bottom 10 - TSX60 Strategy)
Again, the belief that successful investing is the ability to "buy low/sell high" has often resulted in selling too early in an uptrend and buying too early in a downtrend. Buying strength and selling weakness aligns yourself with the market direction. It is often wrongly believed to simply be a strategy where you buy something that has already moved up in price significantly ... this is not the case using our Relative Strength Methodology! We are buying investments that are showing "strength" relative to its peer group, no matter what direction the market is moving: either up, down or sideways. Similarly, selling weakness is crucial for an effective risk management strategy as you "cut your losses short" and reallocate back into strength. Our Methodology focuses on "risk management first ... returns second!" The best way to generate long term positive returns is to first control your downside risk! Trying to fight a declining market or stock is a very difficult strategy to implement over a full market cycle, you are essentially going against the "collective opinion of the market" and this is not a battle that puts the odds in your favour. Yes there will be times when you just happen to catch the bottom of the move in a stock, but a bottom-feeding strategy has a low probability of success over the long term. Let the market tell you when selling pressure is exceeding buying pressure and simply adapt to the changing direction. To illustrate the differences in risk and return between buying strength vs. buying weakness we backtested a strategy where we chose the Bottom 10 stocks on a relative strength basis with the same rules as the above backtest. The results compared to its benchmark (iShares S&P/TSX60 Index ETF) were as follows: 0.04% CAGR over 7 years vs. 4.12%, Annualized Std. Deviation of 19.95% vs. 11.90% and Maximum Drawdown of -36.18% vs. -47.16%.
Comparing the results of the Top 10 vs Bottom 10 backtests:
Return: 21.59% vs. 0.04% (Top vs Bottom)
Standard Deviation: 10.40% vs. 19.95% (Top vs Bottom)
Maximum Drawdown: -16.69% vs. -36.18% (Top vs Bottom)
Disclaimer: these hypothetical backtested strategies are simply illustrations meant to explain the benefits of buying strength and avoiding weakness and not meant to be recommended as a Model, as results may vary depending on the timeframe chosen and the starting dates.
Click on Image to Enlarge
SIACharts.com specifically represents that it does not give investment advice or advocate the purchase or sale of any security or investment. None of the information contained in this website or document constitutes an offer to sell or the solicitation of an offer to buy any security or other investment or an offer to provide investment services of any kind. Neither SIACharts.com (FundCharts Inc.) nor its third party content providers shall be liable for any errors, inaccuracies or delays in content, or for any actions taken in reliance thereon.
For any questions on this concept, please call or email us at 1-877-668-1332 or siateam@siacharts.com.