by Adam Grimes
So the stock market sold off hard yesterday. If you were living under a big enough rock you might have missed it, but now the doom and gloomers, the technicians pointing at broken “levels” and trendlines, and the permabears will probably be saturating the media for a few days. This is ok, and it’s even healthy for the market, but we can do better than soundbites and opinions. History–market history–can give us some idea what might really be coming in the future.
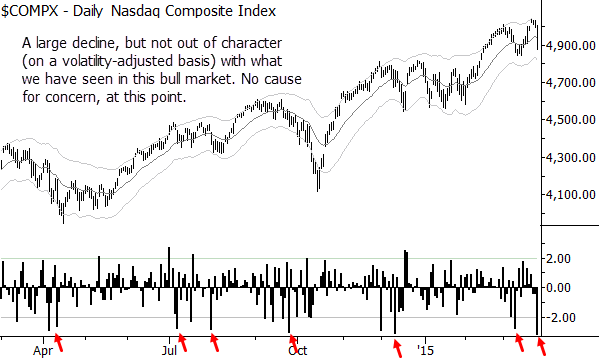
The selloff was large, but not huge. Looking at a price chart, yesterday’s decline might seem scary, but we should always consider market moves in context of that market’s recent volatility; on the chart above, that measure is plotted below the price chart. (We call this SigmaSpikes in the research I write for Waverly Advisors, and it’s one of the main tools I use to look at every market we follow.) From this chart, we can see that this day stands out, but it certainly is not a disaster. Now, let’s look at what happens after a large down day like this:
It’s one thing to talk about statistics, but the chart above lets us see market history in action. Each trace on the chart is what happens following a -2.5 sigma down day; the chart also flashes the average of those days in blue once the chart is complete. Watch it a few times through, and notice a few things:
- Most of the lines pile up near the middle of the chart, but they seem to be leaning to the upside.
- However, there are some very large “surprises”–both up and down.
- A lot of the “bad surprises” come during the 2008 financial crisis. (Maybe this is not a relevant point.)
- The overall average is slightly above zero meaning that…
Yes, stocks tend to bounce after large selloffs. Stocks snap back, or another way to same thing is that they mean-revert over moderately long timeframes. If you’re a tables and numbers kind of person, here’s the same information in a table format:
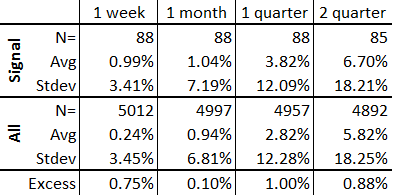
Here we can see that there is (very) slightly positive outperformance over all time periods measured. Surprisingly, volatility has not been higher following large declines, meaning that we have no reason to expect any more volatile trading in the future. Bottom line: stocks tend to snap back after a selloff. This time could, of course, be different, but we’re in a bull market and smart bets, at least on longer timeframes, are going to be placed with that trend, not against it.
Copyright © Adam Grimes